We’ve been through some turbulent times worldwide since 2020. COVID-19 and consequent panic buying and restrictions on worldwide trade led to empty shelves in many grocery stores around the world in early to mid 2020. This was a bad scenario for retailers and suppliers, as not being able to provide the required goods came with reputational costs. Suppliers ramped up their inventory in response to the uptick in consumption during COVID and in anticipation of the increase of other demand after COVID through the end of 2021. This would have not been a big issue if demand had steadily returned to pre-COVID levels, but the war in Ukraine started and consumers unexpectedly decreased their consumption in the wake of economic downturn and inflation concerns in the western world in early 2022. Consequently, suppliers along the supply chain ended up with overcrowded warehouses as demand was not nearly at the anticipated levels. This led to dramatic costs in storage and ongoing disruptions in supply since orders need to be reduced upstream the supply chain. But how can this happen despite the economic incentives for all parties along the supply chain to act in their own best interest?
MobLab’s Beer Game based on the game invented by Jay Wright Forrester, can help you explore this question with your students:
 Gameplay
Students are embedded in four person groups where each student takes a unique role in a supply chain. Each group contains one producer, one distributor, one wholesaler, and a retailer. Goods flow downstream: factories sell to distributors, distributors sell to wholesalers, and wholesalers sell to retailers. On the other hand, purchase orders flow upstream through the supply chain. The retailer has information on consumer demand. This informs purchase orders submitted to the wholesaler, which in turn influences wholesaler purchase orders submitted to the distributor, and so on.
Our initial problem
Returning to our initial supply chain problem, what do we expect to learn from this game? This game illustrates what is know as the bullwhip effect. The bullwhip effect is characterized by how sudden changes in consumer demand generate larger and larger changes in order submissions upstream through the supply chain. What happens in our scenario is that as some consumption is increasing during COVID, factories, distributors, wholesalers and retailers are each interpreting the demand signaled by consumers and increasing their order to avoid any backlog costs that come with dissatisfied consumers. However, the increase is amplified from level to level in the supply chain because the danger of backlog cost leads to compounding excess orders at each level. This turns an initial shortage into an eventual surplus in goods. In our particular case this problem is exacerbated as the demand sharply decreased due to the looming recession concerns and inflation issues.
Results
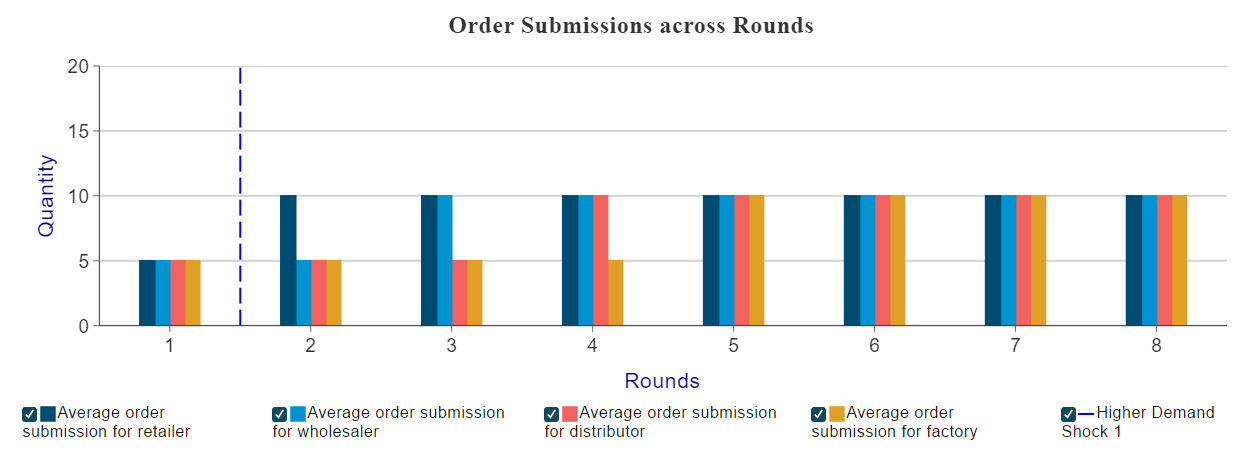
One big benefit of using MobLab is that in our game you can debrief the teaching point with your students immediately after play. For the beer game, we supply you (pun intended) with two graphs. Figure 1 plots order submissions across rounds and is color coded by firm type. A dashed vertical line between rounds indicates a demand shock.

Figure 1: Order Submissions Across Rounds
We can observe how after a demand shock, all players in the supply chain increase their orders successively until a new higher level is reached.
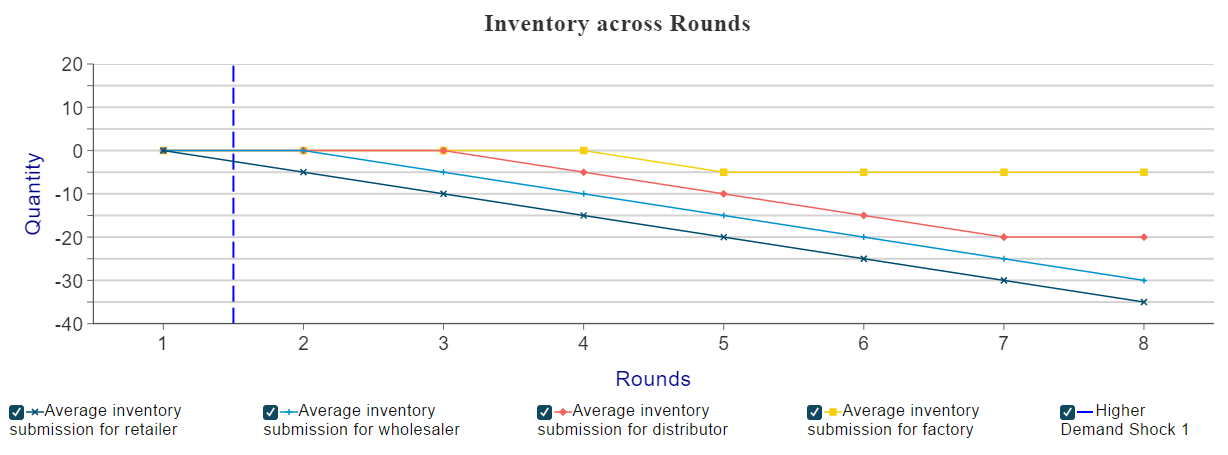
Meanwhile, because there is a delay in receiving newly placed orders, firms dip into available inventory and move deeper and deeper into back orders before those larger deliveries arrive. This is what would have happened with the stock accumulated after COVID. You can show this with Figure 2, which plots a line-graph of inventory across rounds for each role (negative inventory indicates there are back orders). As before, firm types are color coded and dashed vertical lines between rounds indicate a change in customer demand.

Figure 2: Inventory Across Rounds
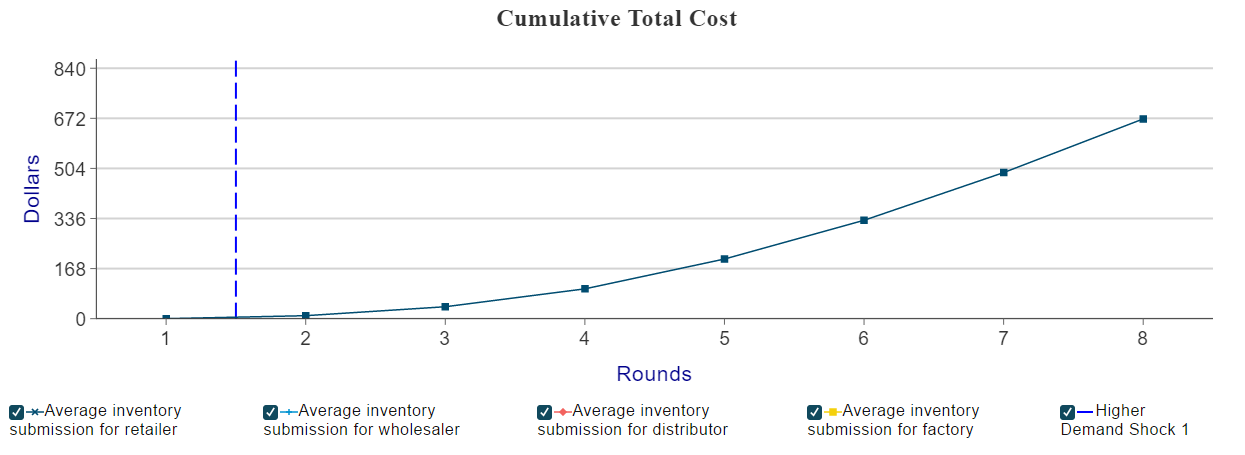
Finally, you can show your students the cumulative total cost across rounds for each supply chain. Total cost refers to all the carrying costs for inventory, and the penalties from unmet demand incurred by all members in a supply chain in a given round. This will illustrate the inefficiency this unintended effect produces at the societal level.

Figure 3: Cumulative Total Cost
Conclusion
Our Beer Game is an excellent way to teach your students the bullwhip effect and demonstrate how to understand some of the supply chain economics issues we have been facing for the last two years worldwide and as it stands, will remain with us for the foreseeable future.
Want to see more games for teaching supply chain economics operations? Get in touch and we would be happy to give you a personalized tour of the MobLab economics game platform.
MobLab’s Beer Game based on the game invented by Jay Wright Forrester, can help you explore this question with your students:

Students are embedded in four person groups where each student takes a unique role in a supply chain. Each group contains one producer, one distributor, one wholesaler, and a retailer. Goods flow downstream: factories sell to distributors, distributors sell to wholesalers, and wholesalers sell to retailers. On the other hand, purchase orders flow upstream through the supply chain. The retailer has information on consumer demand. This informs purchase orders submitted to the wholesaler, which in turn influences wholesaler purchase orders submitted to the distributor, and so on.
Our initial problem
Returning to our initial supply chain problem, what do we expect to learn from this game? This game illustrates what is know as the bullwhip effect. The bullwhip effect is characterized by how sudden changes in consumer demand generate larger and larger changes in order submissions upstream through the supply chain. What happens in our scenario is that as some consumption is increasing during COVID, factories, distributors, wholesalers and retailers are each interpreting the demand signaled by consumers and increasing their order to avoid any backlog costs that come with dissatisfied consumers. However, the increase is amplified from level to level in the supply chain because the danger of backlog cost leads to compounding excess orders at each level. This turns an initial shortage into an eventual surplus in goods. In our particular case this problem is exacerbated as the demand sharply decreased due to the looming recession concerns and inflation issues.
Results
One big benefit of using MobLab is that in our game you can debrief the teaching point with your students immediately after play. For the beer game, we supply you (pun intended) with two graphs. Figure 1 plots order submissions across rounds and is color coded by firm type. A dashed vertical line between rounds indicates a demand shock.

Figure 1: Order Submissions Across Rounds
Meanwhile, because there is a delay in receiving newly placed orders, firms dip into available inventory and move deeper and deeper into back orders before those larger deliveries arrive. This is what would have happened with the stock accumulated after COVID. You can show this with Figure 2, which plots a line-graph of inventory across rounds for each role (negative inventory indicates there are back orders). As before, firm types are color coded and dashed vertical lines between rounds indicate a change in customer demand.

Figure 2: Inventory Across Rounds

Figure 3: Cumulative Total Cost
Our Beer Game is an excellent way to teach your students the bullwhip effect and demonstrate how to understand some of the supply chain economics issues we have been facing for the last two years worldwide and as it stands, will remain with us for the foreseeable future.
Want to see more games for teaching supply chain economics operations? Get in touch and we would be happy to give you a personalized tour of the MobLab economics game platform.

