The concept of Asymmetric Information is an important topic covered in principles and upper-level economics courses. Many instructors refer to Akerlof’s seminal paper, The Market for "Lemons," which displays how the quality of goods transacted in a used car market can break down in the presence of information asymmetry between buyers and sellers.
Instructors have enjoyed using MobLab experiments to introduce market failures in the presence of asymmetric information using Akerlof’s example, including the Market for Lemons (2-player game); and the Lemon Market Buyer (1-player game). These two games exhibit how transactions may break down between a single buyer & single seller.
However, this phenomenon is widespread and affects entire markets as opposed to just individual transactions, which is why we developed our Insurance Market game (and accompanying asynchronous module). With MobLab's insurance market game, students experience the death spiral resulting from adverse selection in insurance markets. When playing the insurance market game, instructors may assume that students have not been introduced to the concept of adverse selection, but it would be useful if students can calculate expected value.

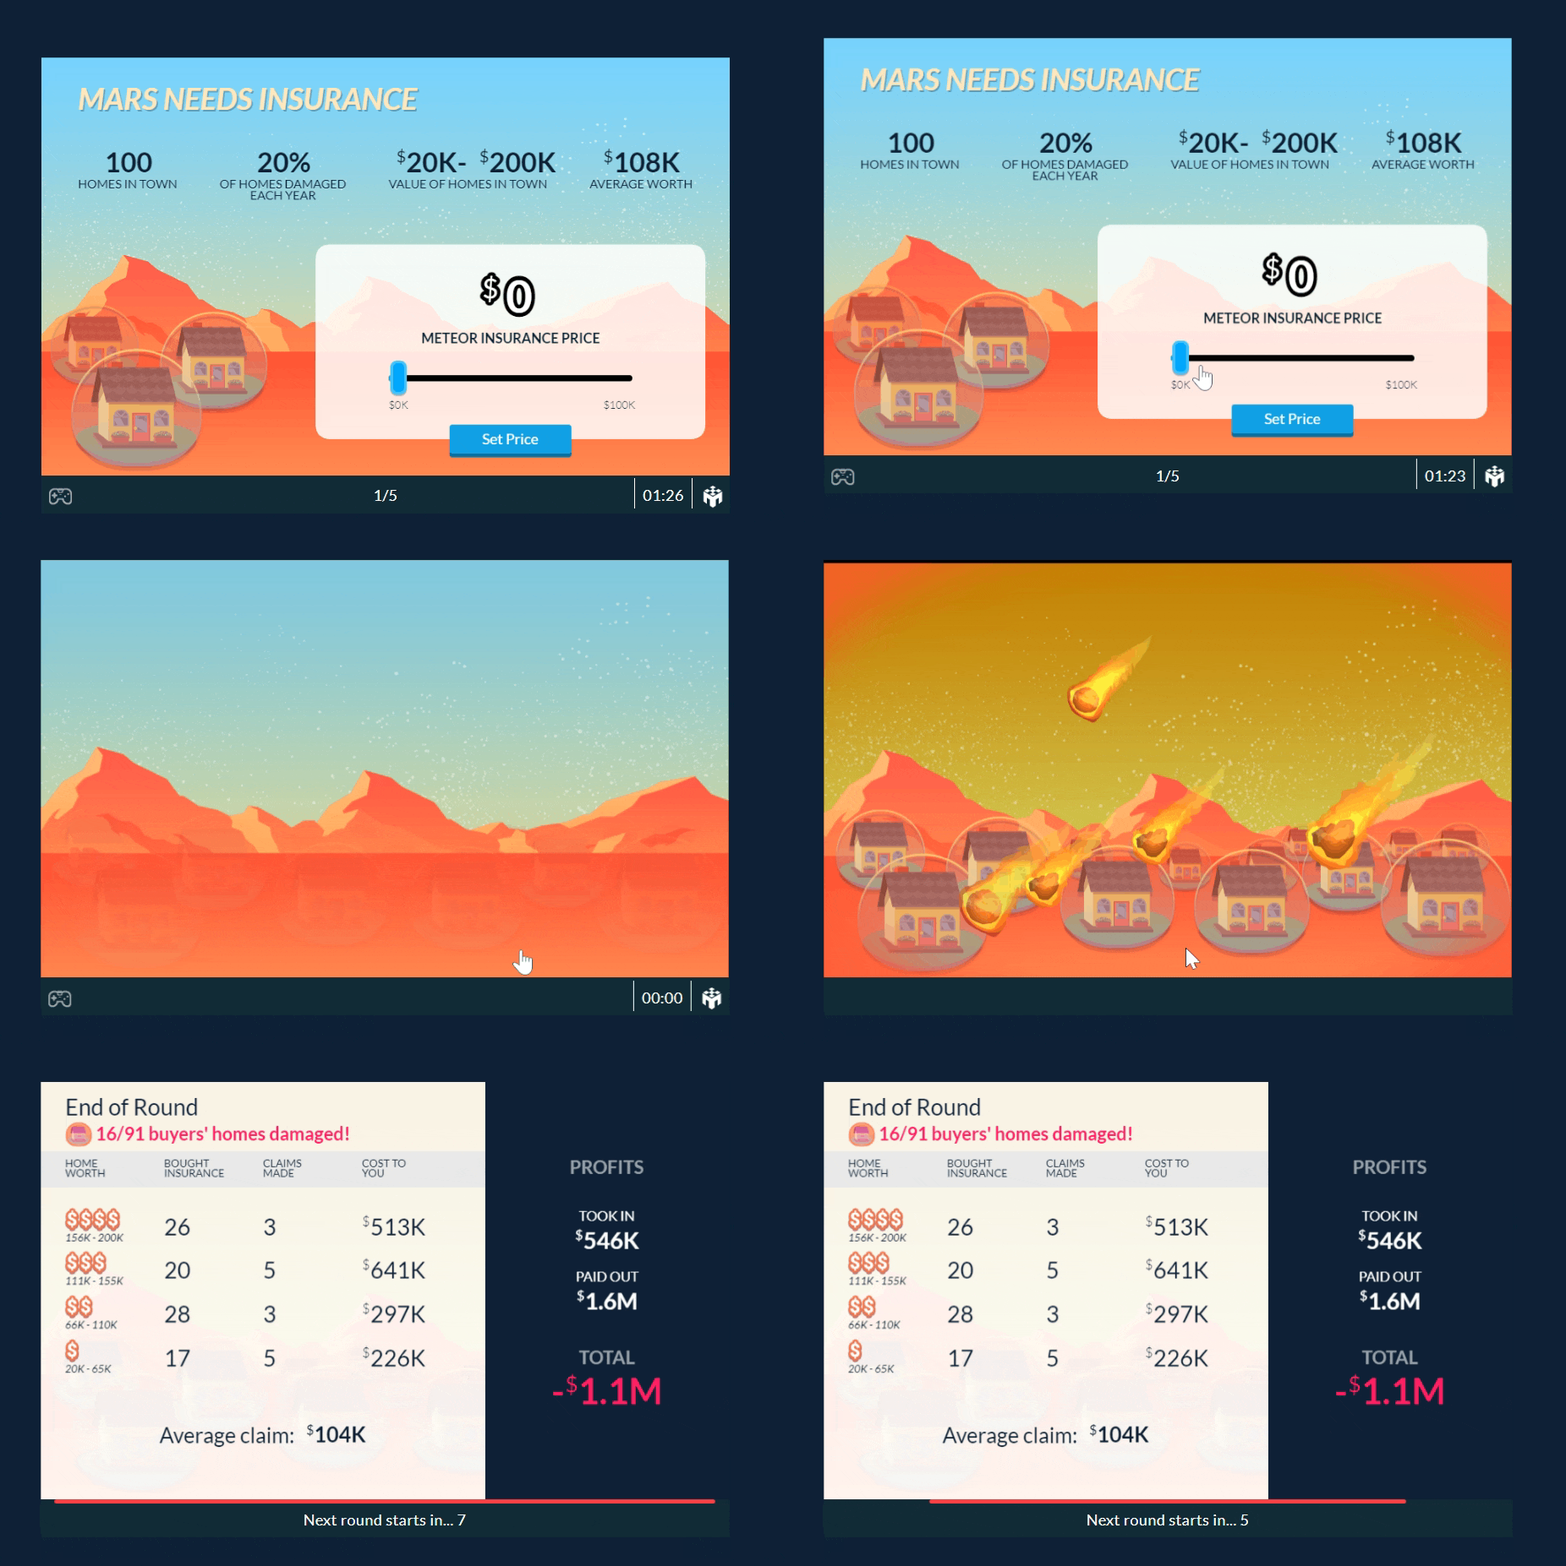
Each student plays individually and takes the role of an insurance company, selling housing insurance to a town plagued by meteors. The distribution of home values is known to be uniform and ranges from $20k to $200k in the default settings. Due to asymmetric information regarding the home values and the lack of screening options on Mars, the insurance company is constrained to setting only one price for the entire town - a classic approach to asymmetric information.
The Insurance Market game has three main learning objectives:
Learning Objective 1: Asymmetric Information
Asymmetric Information constrains the insurance company to set a single price for the entire town, whereas homeowners individually decide whether or not to buy the insurance based on the price and their home value.
Learning Objective 2: Adverse Selection
High-value homeowners who are a higher risk to the insurance company tend to insure themselves whereas low-value homeowners evaluate the insurance as too expensive and opt out.
Learning Objective 3: The Death Spiral
The Death Spiral resulting from adverse selection drives out low risk homeowners and forces the insurance company to raise the price every period which will eventually lead to a total collapse of the market.
With this game, your students may explore different pricing strategies to find out how the market mechanisms work. Simply put, choosing a low price will create a market where many homes can buy insurance. Unfortunately, as the insurance company, they are liable to payout claims to any house that is destroyed. Students may be forced to raise their price in the event that they incurred considerable losses due to a low price.
Therefore, the next decision may be that they increase price. However, doing so will result in adverse selection and the eventual death spiral. The low value homes will be price out of the market, and only high-value (high risk) homes can afford the insurance. Since these homes are higher risk, the losses may continue for the student’s insurance company. Eventually, the whole market collapses.
Analyzing the Results
After playing the game, instructors can access the results from the rounds. Let’s take a look at some results from a class:

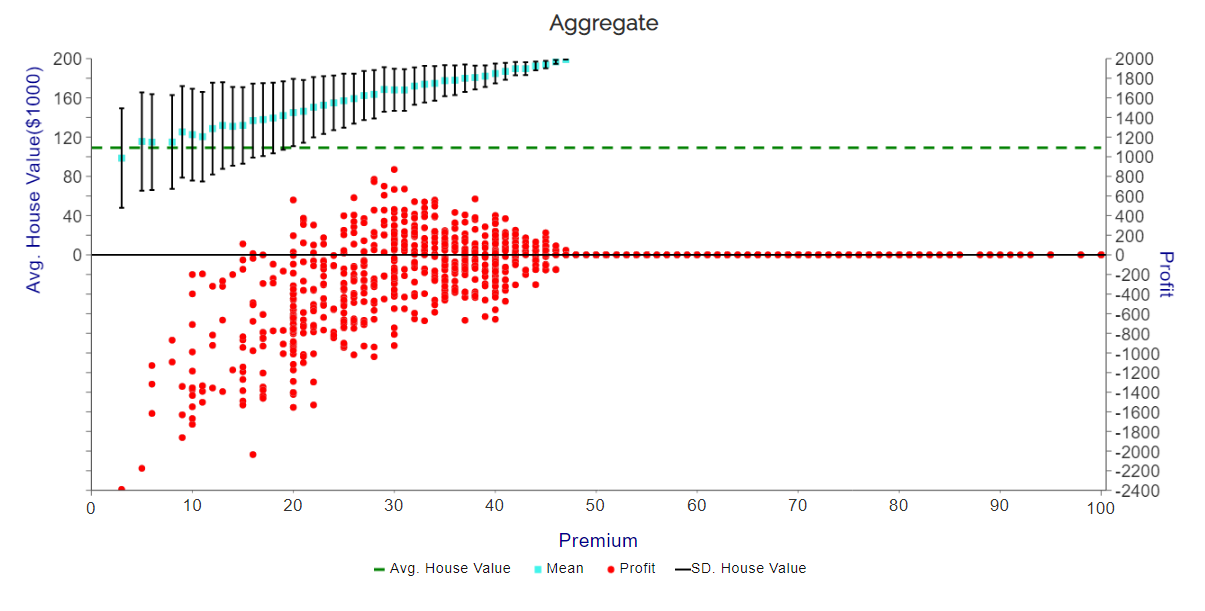
The above graph tells several compelling stories. On the X-Axis, we have the premium. Y-Axis on the left shows the Average House Value who bought insurance. Y-Axis on the right shows the resulting profit.
The red dots show the profits experienced by students across rounds. We notice that red dots on the bottom left of the graph show the instances when a price is set too low, there is a loss experienced by the insurance company . In order to combat that loss, students must make a decision to raise their price. However, when they do, less homes buy insurance. The homeowners who are buying the insurance also are the ones who can afford the higher price, and pose the greater risk to the insurance company.
This is represented by the blue dots with the box & whisker plots on the top left of the graph. Soon enough, as we move from left to right on the X-Axis, we see the Average House Value of those who bought insurance to increase. The further we move to the right, the less homes buy insurance, until none buy it at all (the death spiral). Hence, there are no profits when premiums are set above $50,000 in this example.
The market has surely collapsed!

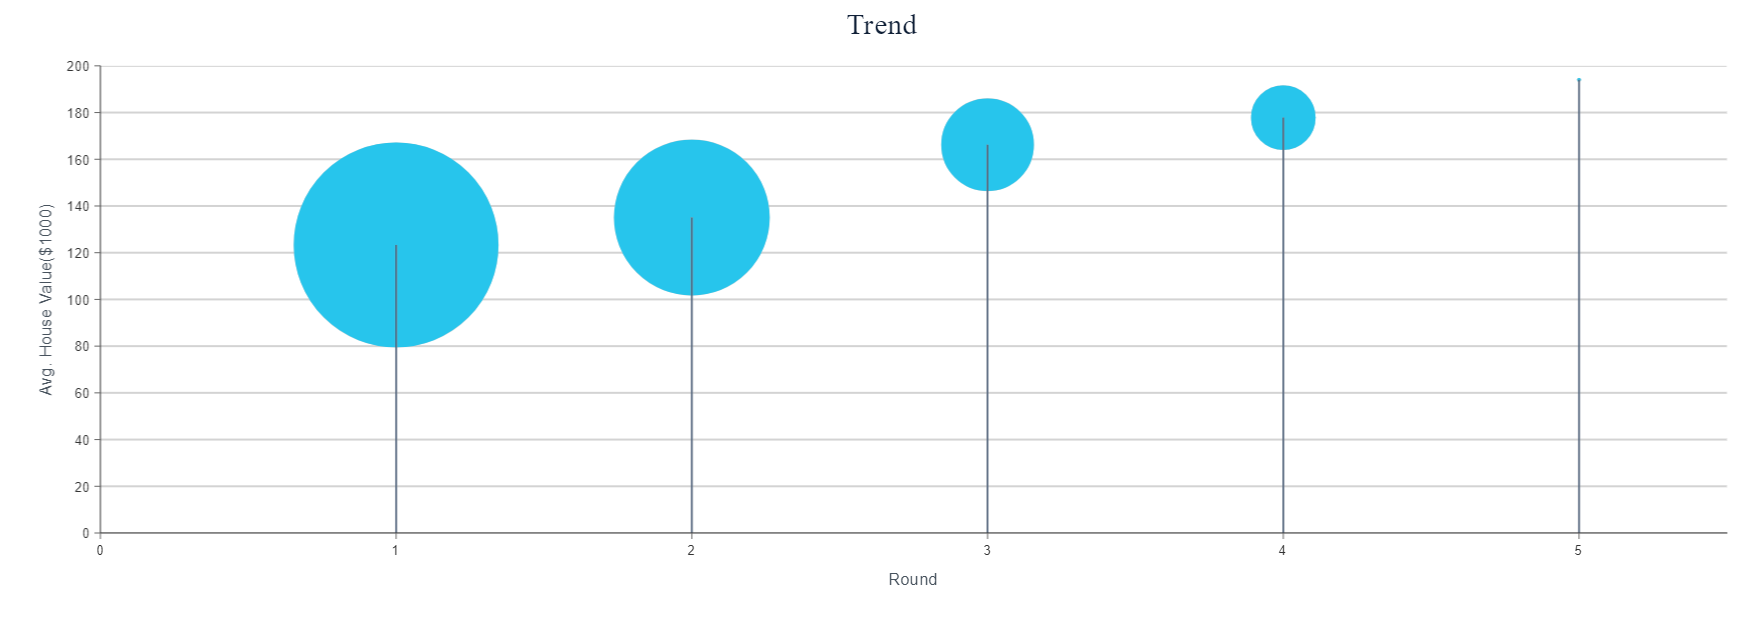
The second graph shown in Figure 3 shows the average home value and frequency of insurance bought. In Round 1, we see a large blue circle which indicates many houses bought insurance. As we move across the X-Axis, fewer and fewer homes are buying insurance (shrinking blue circle). They are also moving at an upward trajectory, which signals that only high-value homes are purchasing the insurance, which confirms the story told to us in Figure 2.
When showing these results, this gives you the ability to discuss with your students about their experiences during gameplay and price-setting. Explain that the value of homes purchasing insurance is higher at higher premiums.
Discussion and Debrief
While this one-player game has a simple interface and is easy to ‘play’ - the real value will come from the results and subsequent debrief.
A few initial sample questions can involve asking students about what lower value homes opting out of the market implies for profitability. Then, ask students about their strategy and how they made their pricing decisions across time, using our Survey Tool.
This game can open up significant discussion about the importance of hidden information and how the nature of some goods poses a problem for markets. Some possible extensions for discussion:Can students think of other goods that are characterized by asymmetric information (e.g. health insurance, legal advice, auto repair, religious guidance, etc.)? Are there technologies, products, or institutional rules that can close the gap in information between buyer and seller? Do some of these solutions pose any ethical problems?
Ready to explore the concepts of asymmetric information and adverse selection through MobLab’s Insurance Market Game? Schedule a one-on-one demo meeting with one of our team members. We're happy to help!
Instructors have enjoyed using MobLab experiments to introduce market failures in the presence of asymmetric information using Akerlof’s example, including the Market for Lemons (2-player game); and the Lemon Market Buyer (1-player game). These two games exhibit how transactions may break down between a single buyer & single seller.
However, this phenomenon is widespread and affects entire markets as opposed to just individual transactions, which is why we developed our Insurance Market game (and accompanying asynchronous module). With MobLab's insurance market game, students experience the death spiral resulting from adverse selection in insurance markets. When playing the insurance market game, instructors may assume that students have not been introduced to the concept of adverse selection, but it would be useful if students can calculate expected value.

Figure 1: Insurance Market Game Screen
Each student plays individually and takes the role of an insurance company, selling housing insurance to a town plagued by meteors. The distribution of home values is known to be uniform and ranges from $20k to $200k in the default settings. Due to asymmetric information regarding the home values and the lack of screening options on Mars, the insurance company is constrained to setting only one price for the entire town - a classic approach to asymmetric information.
The Insurance Market game has three main learning objectives:
Learning Objective 1: Asymmetric Information
Asymmetric Information constrains the insurance company to set a single price for the entire town, whereas homeowners individually decide whether or not to buy the insurance based on the price and their home value.
Learning Objective 2: Adverse Selection
High-value homeowners who are a higher risk to the insurance company tend to insure themselves whereas low-value homeowners evaluate the insurance as too expensive and opt out.
Learning Objective 3: The Death Spiral
The Death Spiral resulting from adverse selection drives out low risk homeowners and forces the insurance company to raise the price every period which will eventually lead to a total collapse of the market.
With this game, your students may explore different pricing strategies to find out how the market mechanisms work. Simply put, choosing a low price will create a market where many homes can buy insurance. Unfortunately, as the insurance company, they are liable to payout claims to any house that is destroyed. Students may be forced to raise their price in the event that they incurred considerable losses due to a low price.
Therefore, the next decision may be that they increase price. However, doing so will result in adverse selection and the eventual death spiral. The low value homes will be price out of the market, and only high-value (high risk) homes can afford the insurance. Since these homes are higher risk, the losses may continue for the student’s insurance company. Eventually, the whole market collapses.
Analyzing the Results
After playing the game, instructors can access the results from the rounds. Let’s take a look at some results from a class:

Figure 2: Actual Class Results
The above graph tells several compelling stories. On the X-Axis, we have the premium. Y-Axis on the left shows the Average House Value who bought insurance. Y-Axis on the right shows the resulting profit.
The red dots show the profits experienced by students across rounds. We notice that red dots on the bottom left of the graph show the instances when a price is set too low, there is a loss experienced by the insurance company . In order to combat that loss, students must make a decision to raise their price. However, when they do, less homes buy insurance. The homeowners who are buying the insurance also are the ones who can afford the higher price, and pose the greater risk to the insurance company.
This is represented by the blue dots with the box & whisker plots on the top left of the graph. Soon enough, as we move from left to right on the X-Axis, we see the Average House Value of those who bought insurance to increase. The further we move to the right, the less homes buy insurance, until none buy it at all (the death spiral). Hence, there are no profits when premiums are set above $50,000 in this example.
The market has surely collapsed!

Figure 3: Actual Class Results
The second graph shown in Figure 3 shows the average home value and frequency of insurance bought. In Round 1, we see a large blue circle which indicates many houses bought insurance. As we move across the X-Axis, fewer and fewer homes are buying insurance (shrinking blue circle). They are also moving at an upward trajectory, which signals that only high-value homes are purchasing the insurance, which confirms the story told to us in Figure 2.
When showing these results, this gives you the ability to discuss with your students about their experiences during gameplay and price-setting. Explain that the value of homes purchasing insurance is higher at higher premiums.
Discussion and Debrief
While this one-player game has a simple interface and is easy to ‘play’ - the real value will come from the results and subsequent debrief.
A few initial sample questions can involve asking students about what lower value homes opting out of the market implies for profitability. Then, ask students about their strategy and how they made their pricing decisions across time, using our Survey Tool.
This game can open up significant discussion about the importance of hidden information and how the nature of some goods poses a problem for markets. Some possible extensions for discussion:
Ready to explore the concepts of asymmetric information and adverse selection through MobLab’s Insurance Market Game? Schedule a one-on-one demo meeting with one of our team members. We're happy to help!

