One of MobLab’s most powerful games is the Competitive Market Game. Not only can students experience hands-on how a market arrives at an equilibrium price and quantity, but they can also see how government interventions change consumer and producer behavior. To add government intervention into the market, simply click on “Basic” and add in a Tax or Subsidy. 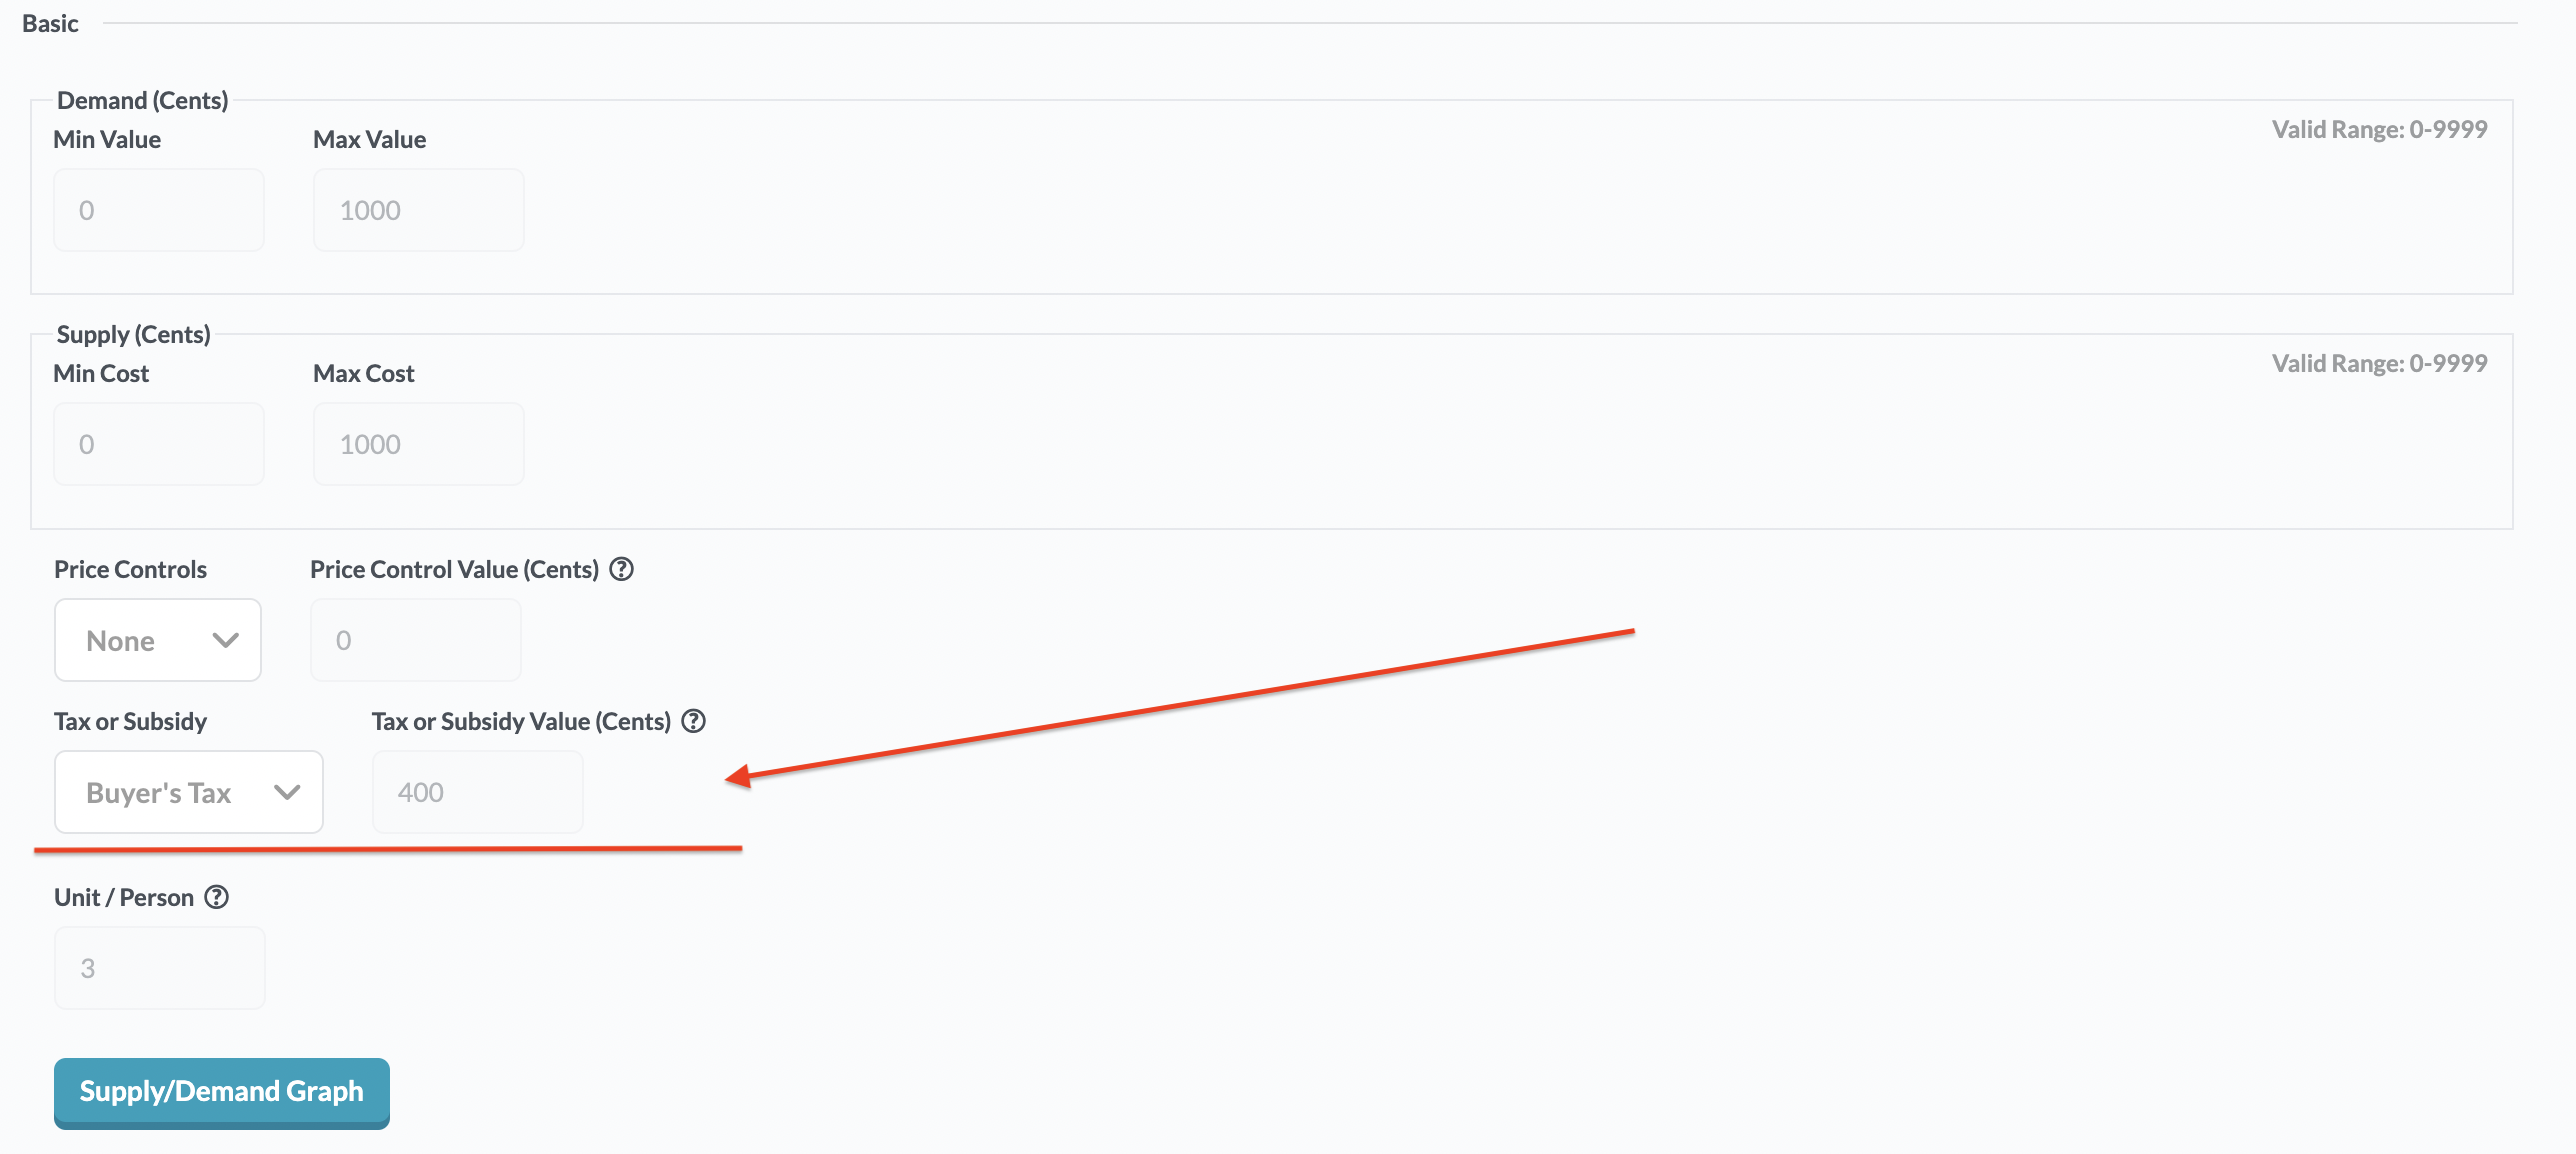
Pro Tip: Run a game without government intervention first. Doing so provides two benefits:
1. Students become familiar with the basic mechanics of the market game.
2. You can compare the results of that market game to the one with a government intervention.
Above is the result from a live market without government intervention from my class last year at University of Minnesota. The parameters were picked to be in line with our class examples, where the maximum value and cost is $10 (max value and cost = 1000) and the minimum value and cost is $0 (min value and cost = 0). Buyers/sellers in the market demand/supply three oranges, and the equilibrium market price for an orange is $5. The transaction price of oranges has higher variance in the beginning, and begins to converge to the equilibrium price of $5 by the end of the round. With the benchmark quantity-price prediction you likely want to demonstrate three lessons: tax incidence, quantity distortion, and deadweight loss.
Pro Tip: Have students take a screenshot of their End of Game screen or increase the time students have to record that information by changing the number of seconds between periods. This can be found in the “Repetition and Duration” tab.
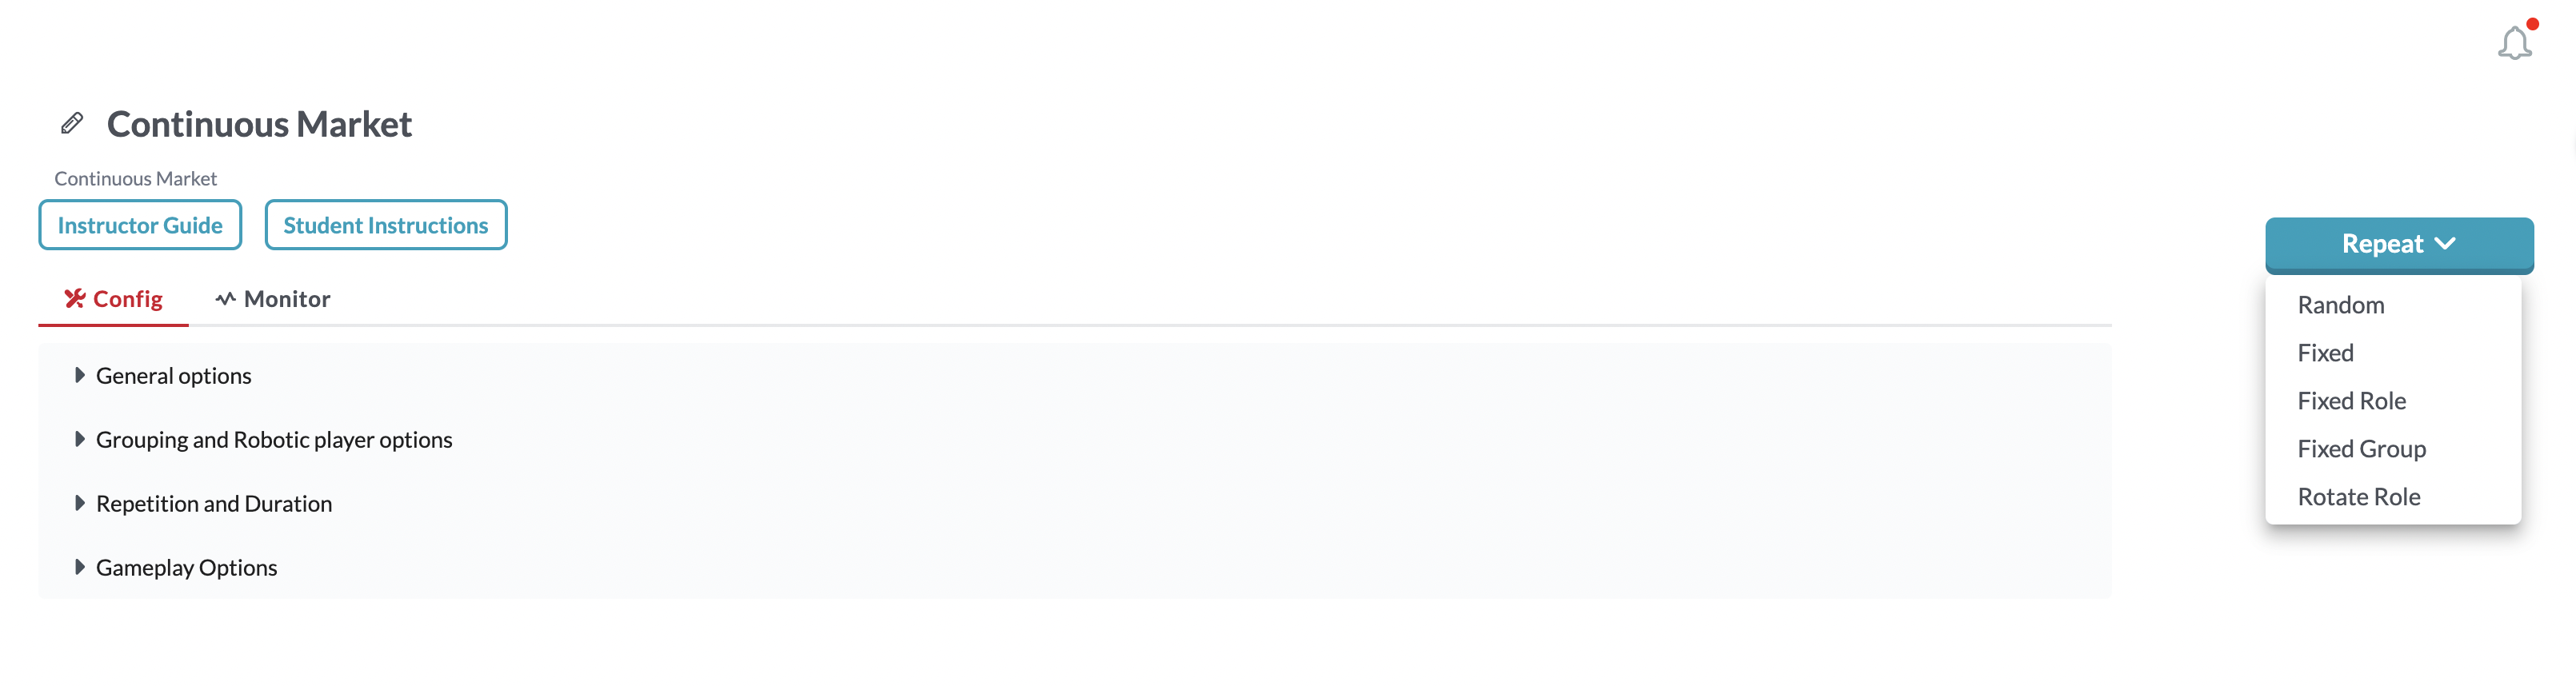
Pro Tip: Using the “Repeat” button will allow you to select “Fixed Role” from the dropdown menu. This ensures that the student will be in the same role after the intervention.
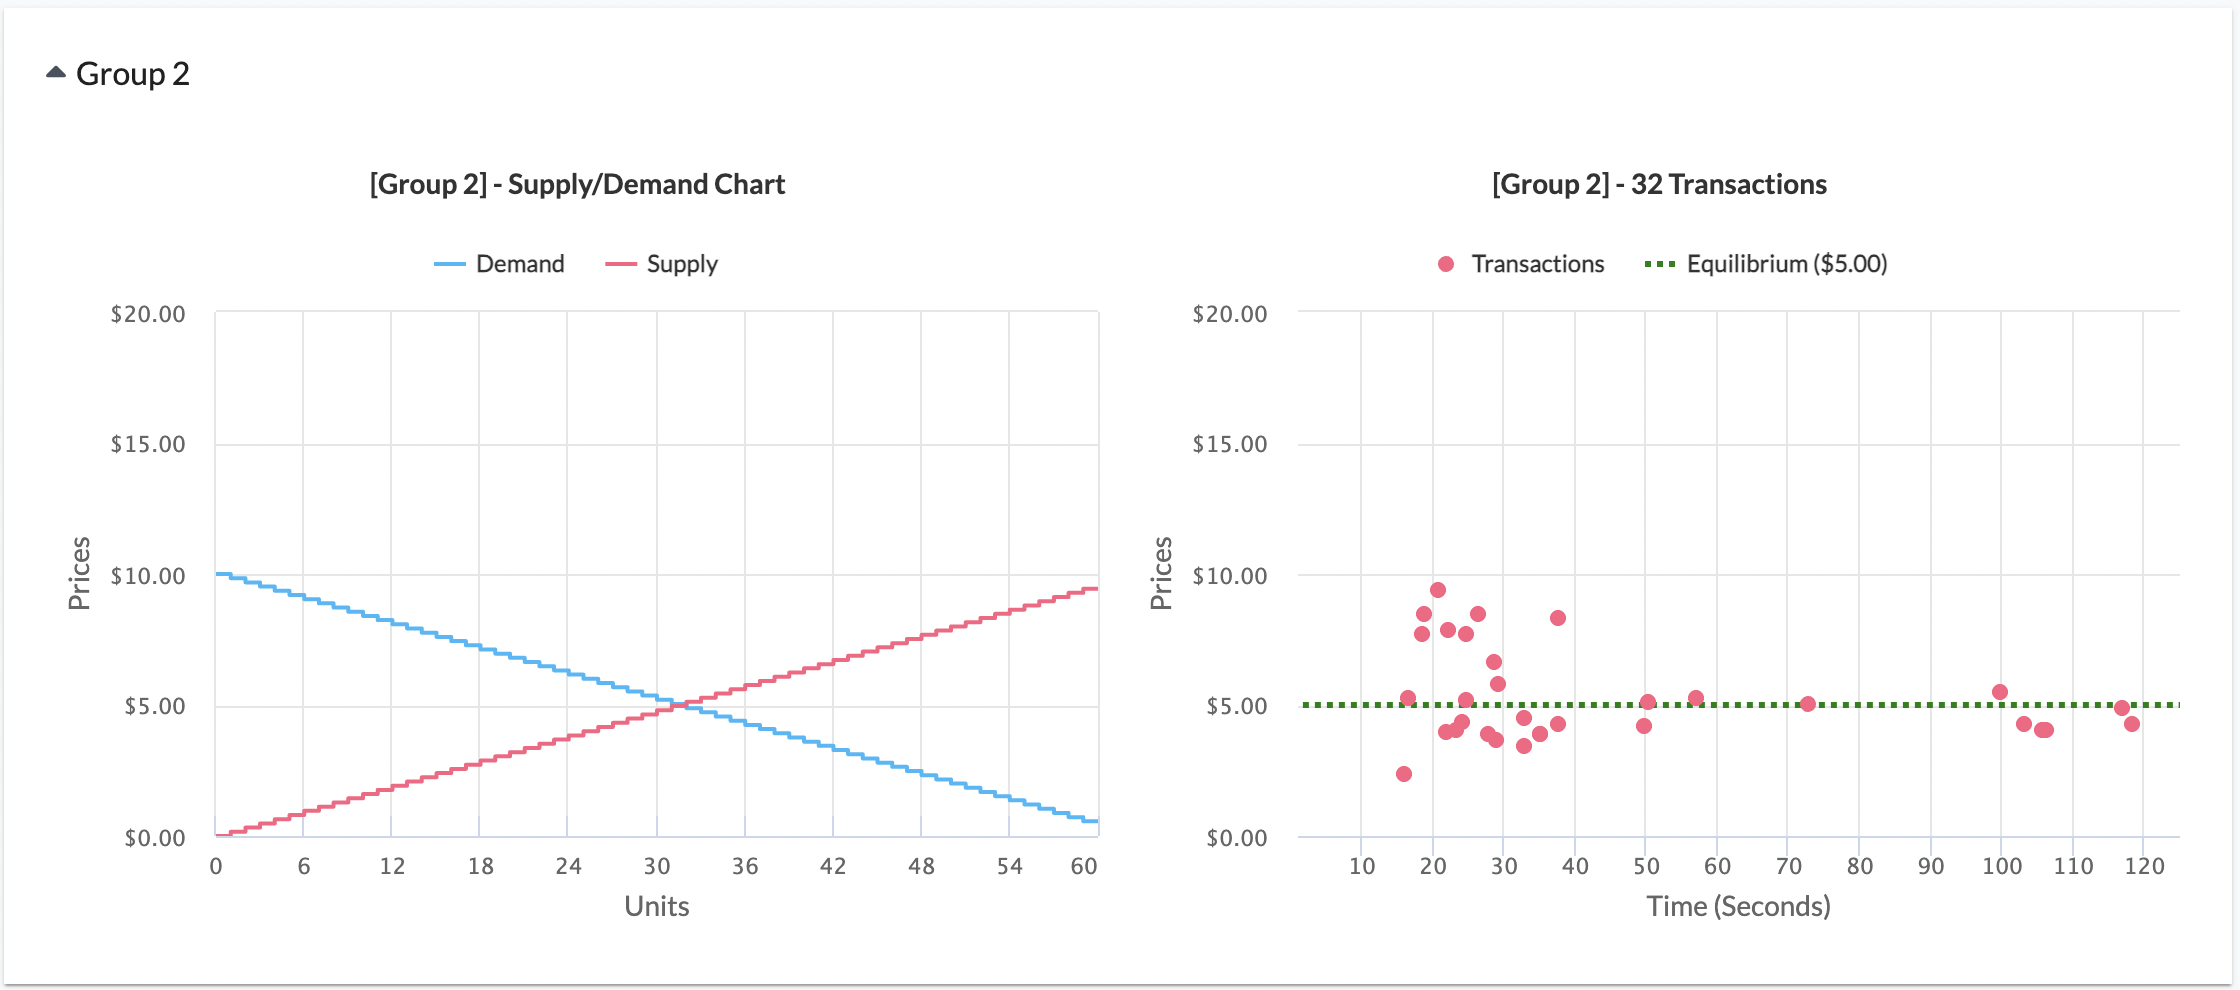
The following data was generated by my class with adding $4 tax on the sellers. 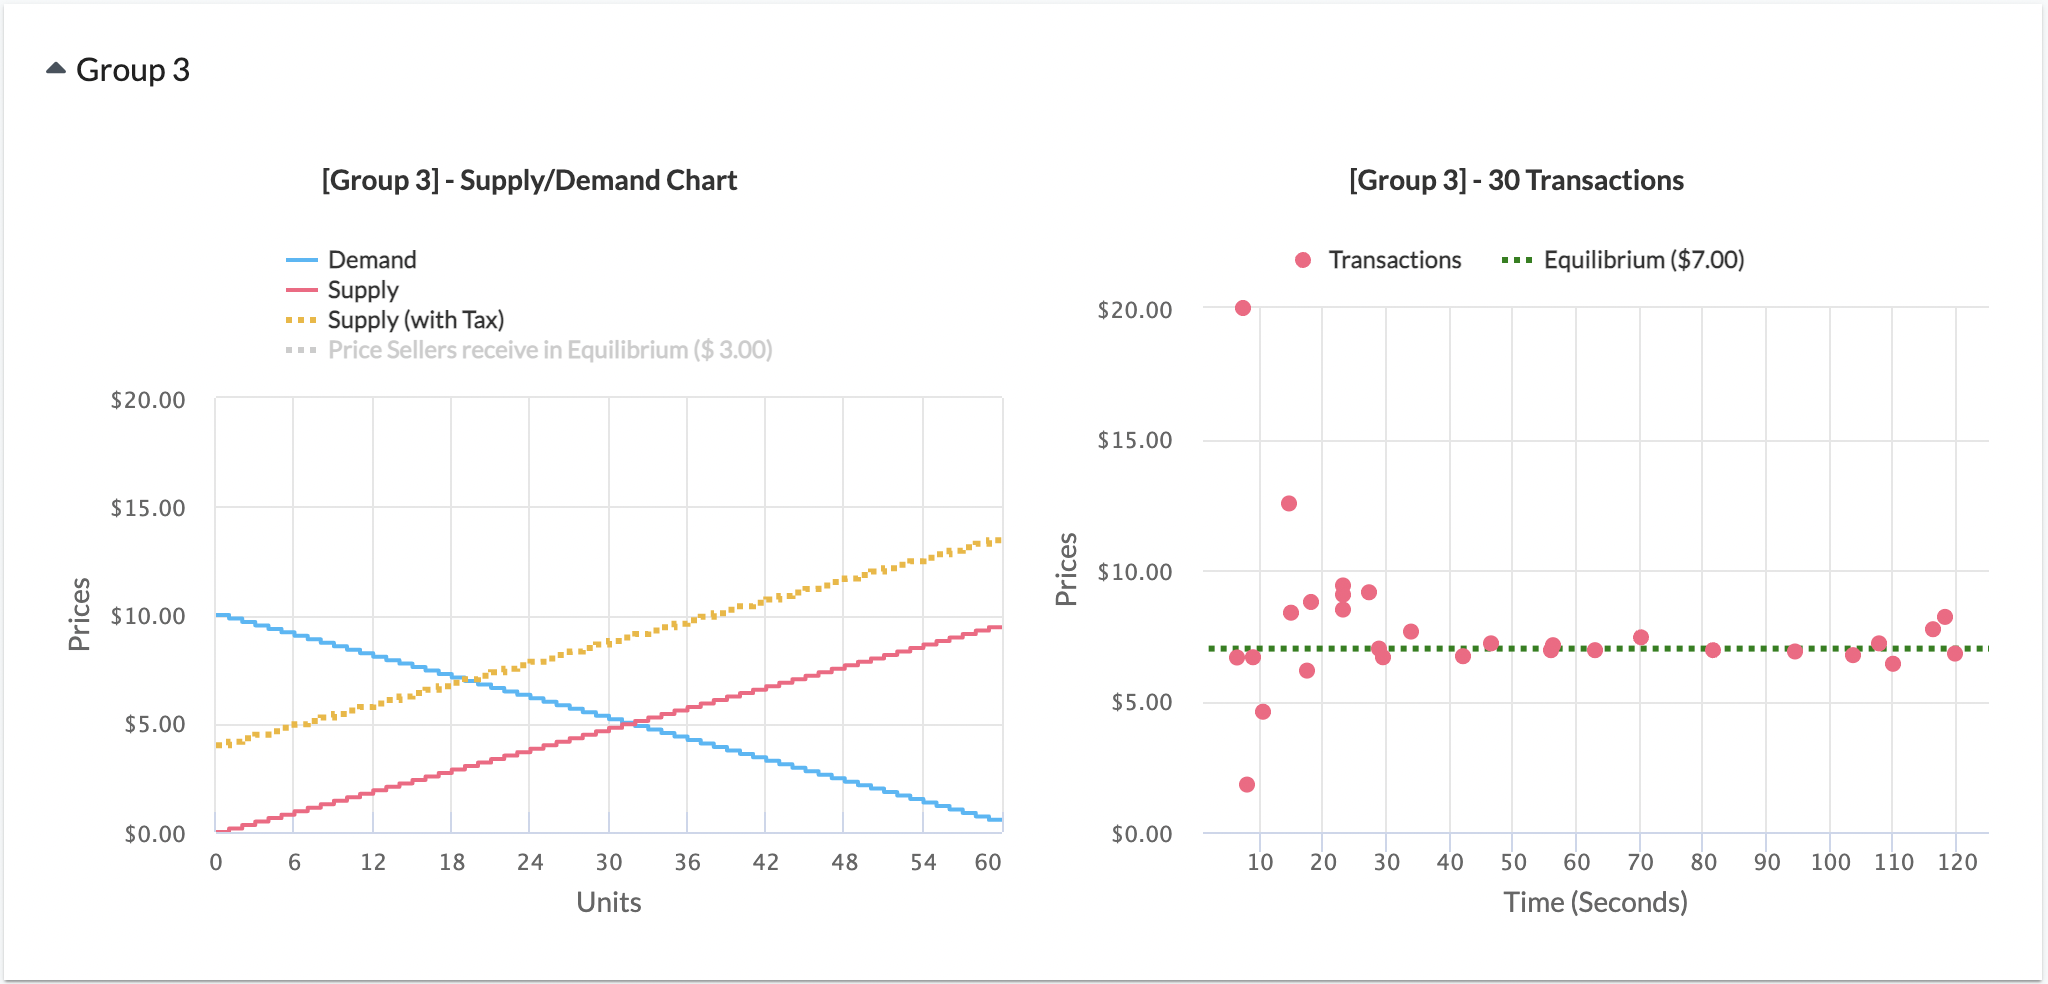
At the beginning of the round the sellers, faced with having to pay the government $4 for every sale, submitted higher asks. Lots of sellers asked for more than $9 to start, since they knew the old equilibrium price was $5. However, there is excess supply and the price begins to fall. We see that the price converges to $7.
Next, a tax of $4 is placed on consumers.
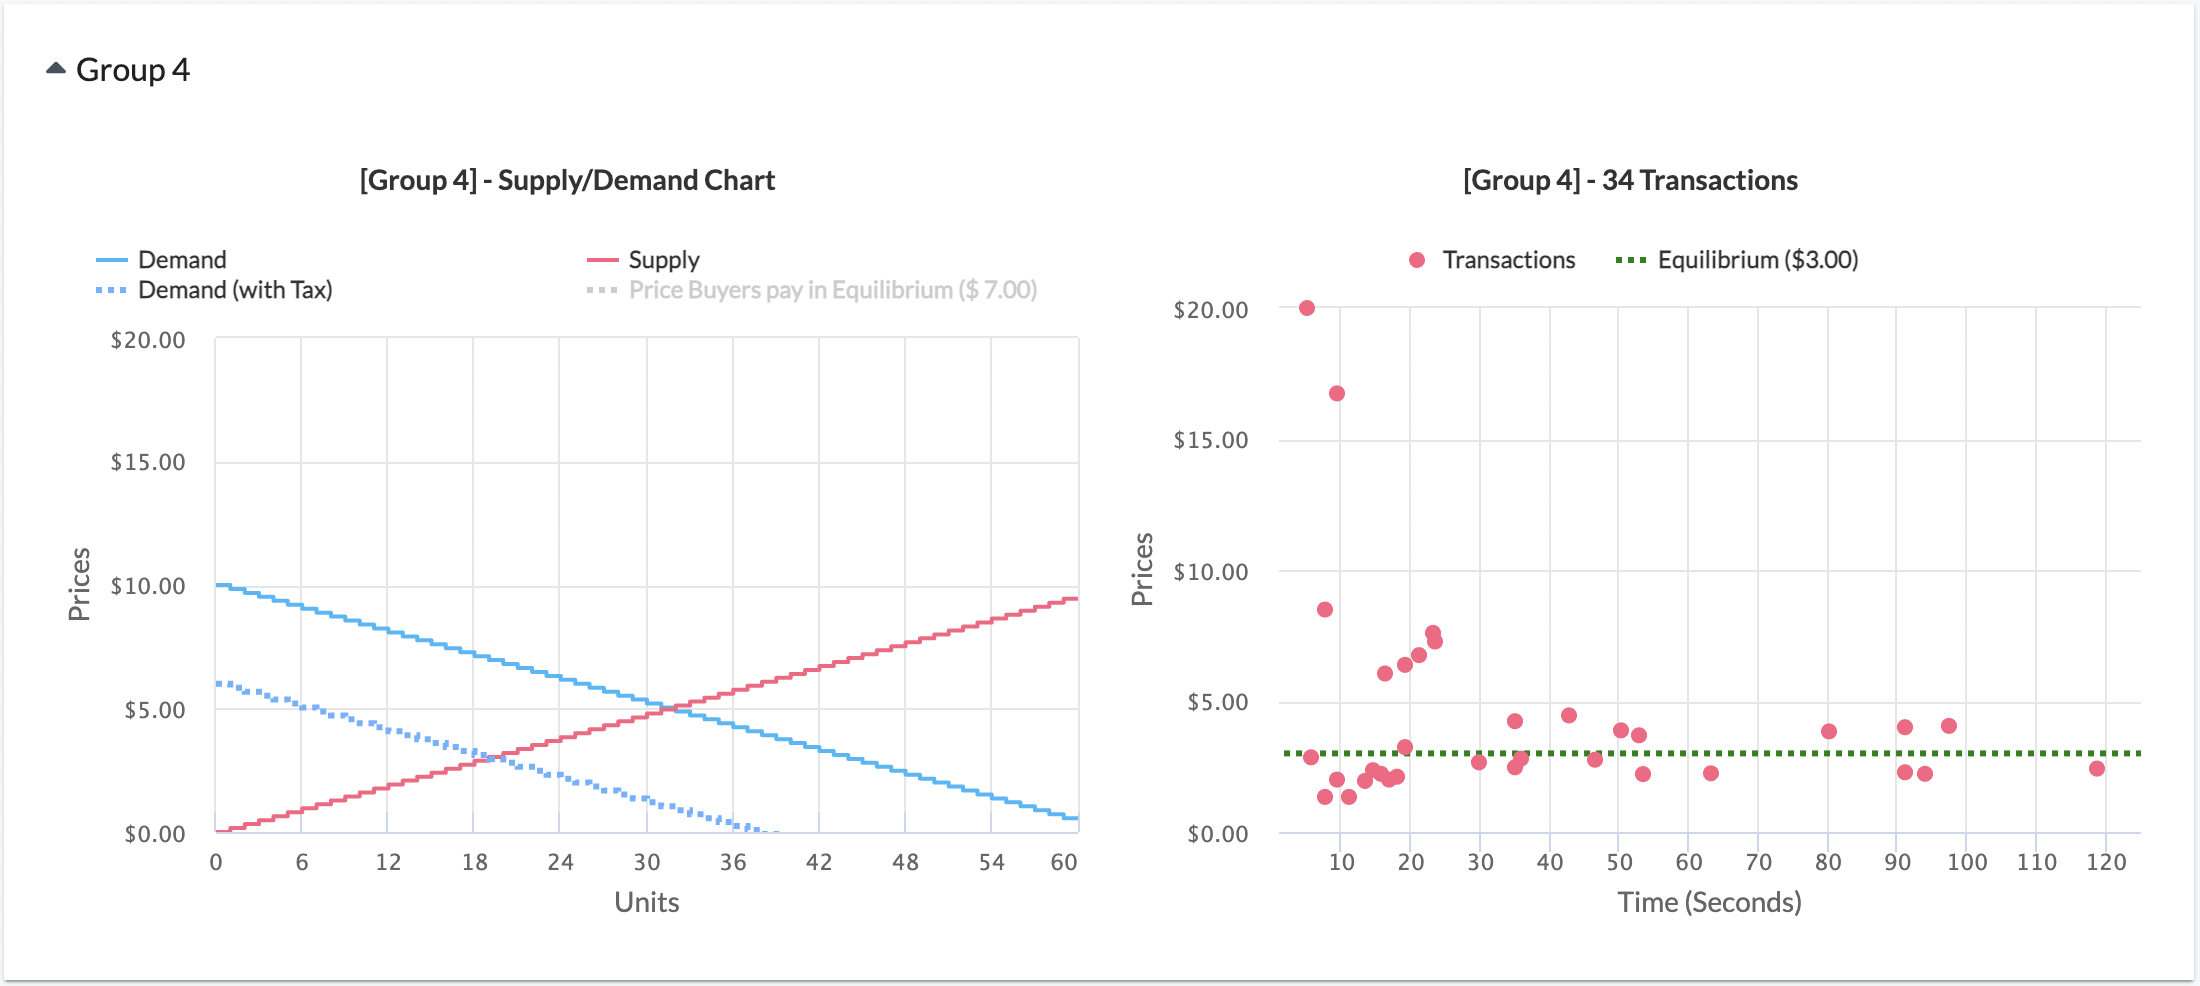
Since consumers know they have to pay $4 to the government for every orange they purchase, they will bid at lower prices. Note that there are some high prices at the start of this round – my impression was that students just finished playing a market game that had an equilibrium price of $7, so their natural instinct was to start their bids and asks around that price.
The quantity distortion the number of units will fall as the result of a tax. Students find it harder to buy or sell, and some find it not worthwhile to do so anymore. Compare the quantity in the benchmark to the quantity with government intervention to make this point. You can do this by comparing the tables side-by-side.
Keep in mind though some students may buy or sell oranges at negative profit. Thus quantity will tend to be higher than expected. For cleaner results I'd recommend at least two repetitions of the competitive market game both with and without intervention.
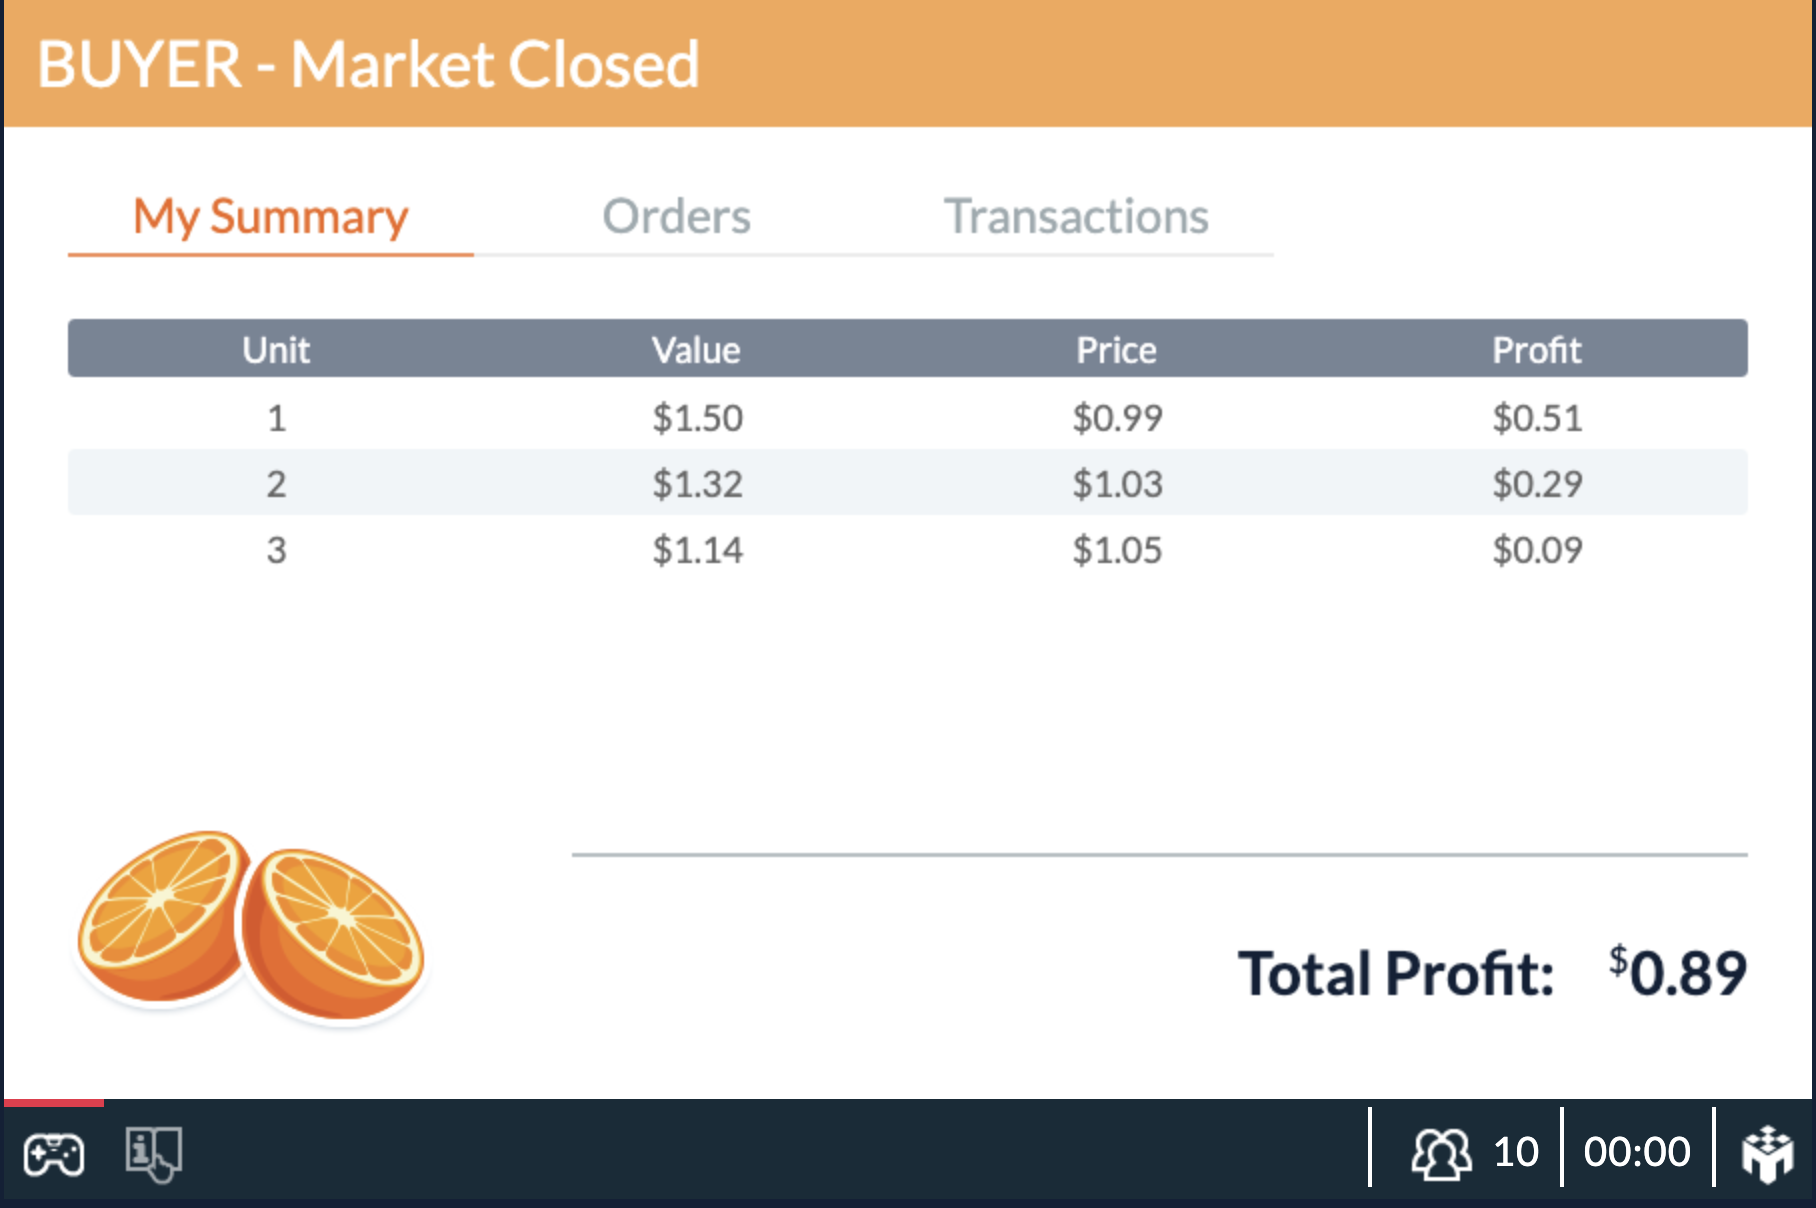
After accounting for government revenue you can also use our tables to show that the total surplus of the market is lower with interventions than in the benchmark, see featured photo. If students played in a profit-maximizing way, the surplus from the game with government intervention will be lower than that of the free market game.
The government intervention configuration is also now available for students to play asychronously with our new Taxes Online Assignment. Would you like to learn more about our online economics games? Get in touch with our team. Schedule a one-on-one demo meeting with us today.