With MobLab’s media feature built into surveys, you can quickly add even more fun to the classroom. Adding media to lectures and class material is a fantastic way to increase student engagement while reinforcing learning. Instructors throughout the hundreds of schools that use MobLab have used media in our surveys to interact more with their students both inside, and even outside, the classroom.
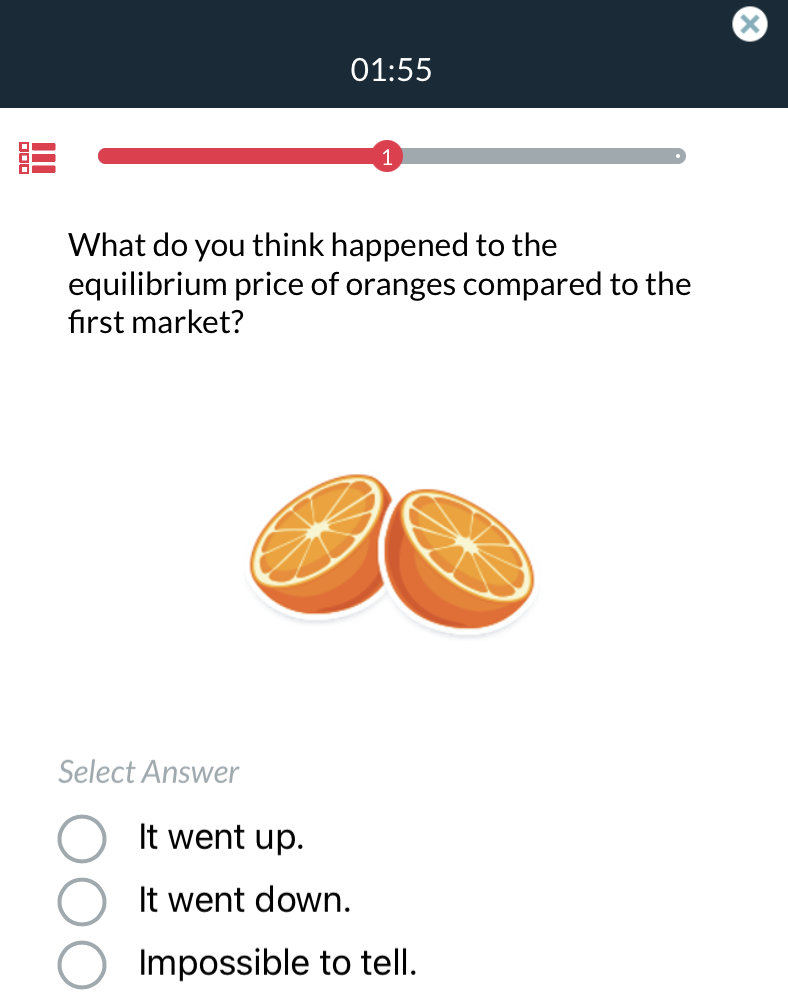
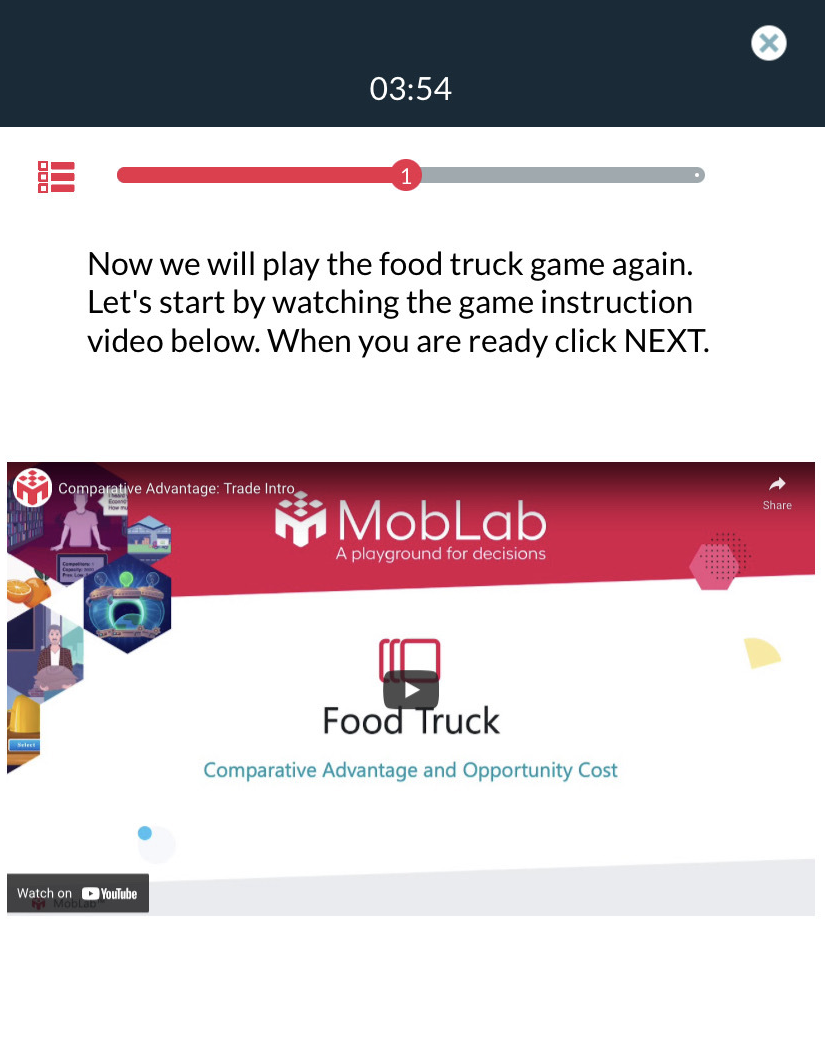
Okay, but why should instructors try using these multimedia features in surveys? Simply put, having a text-only approach can cause some students to lose attention and retention of learning material quickly. By adding media to surveys, instructors can further customize their teaching style ad deliver the learning experience in a memorable way that text simply cannot accomplish in and of itself.
If this is your first time learning about MobLab surveys or need a review, here’s a quick explainer video:
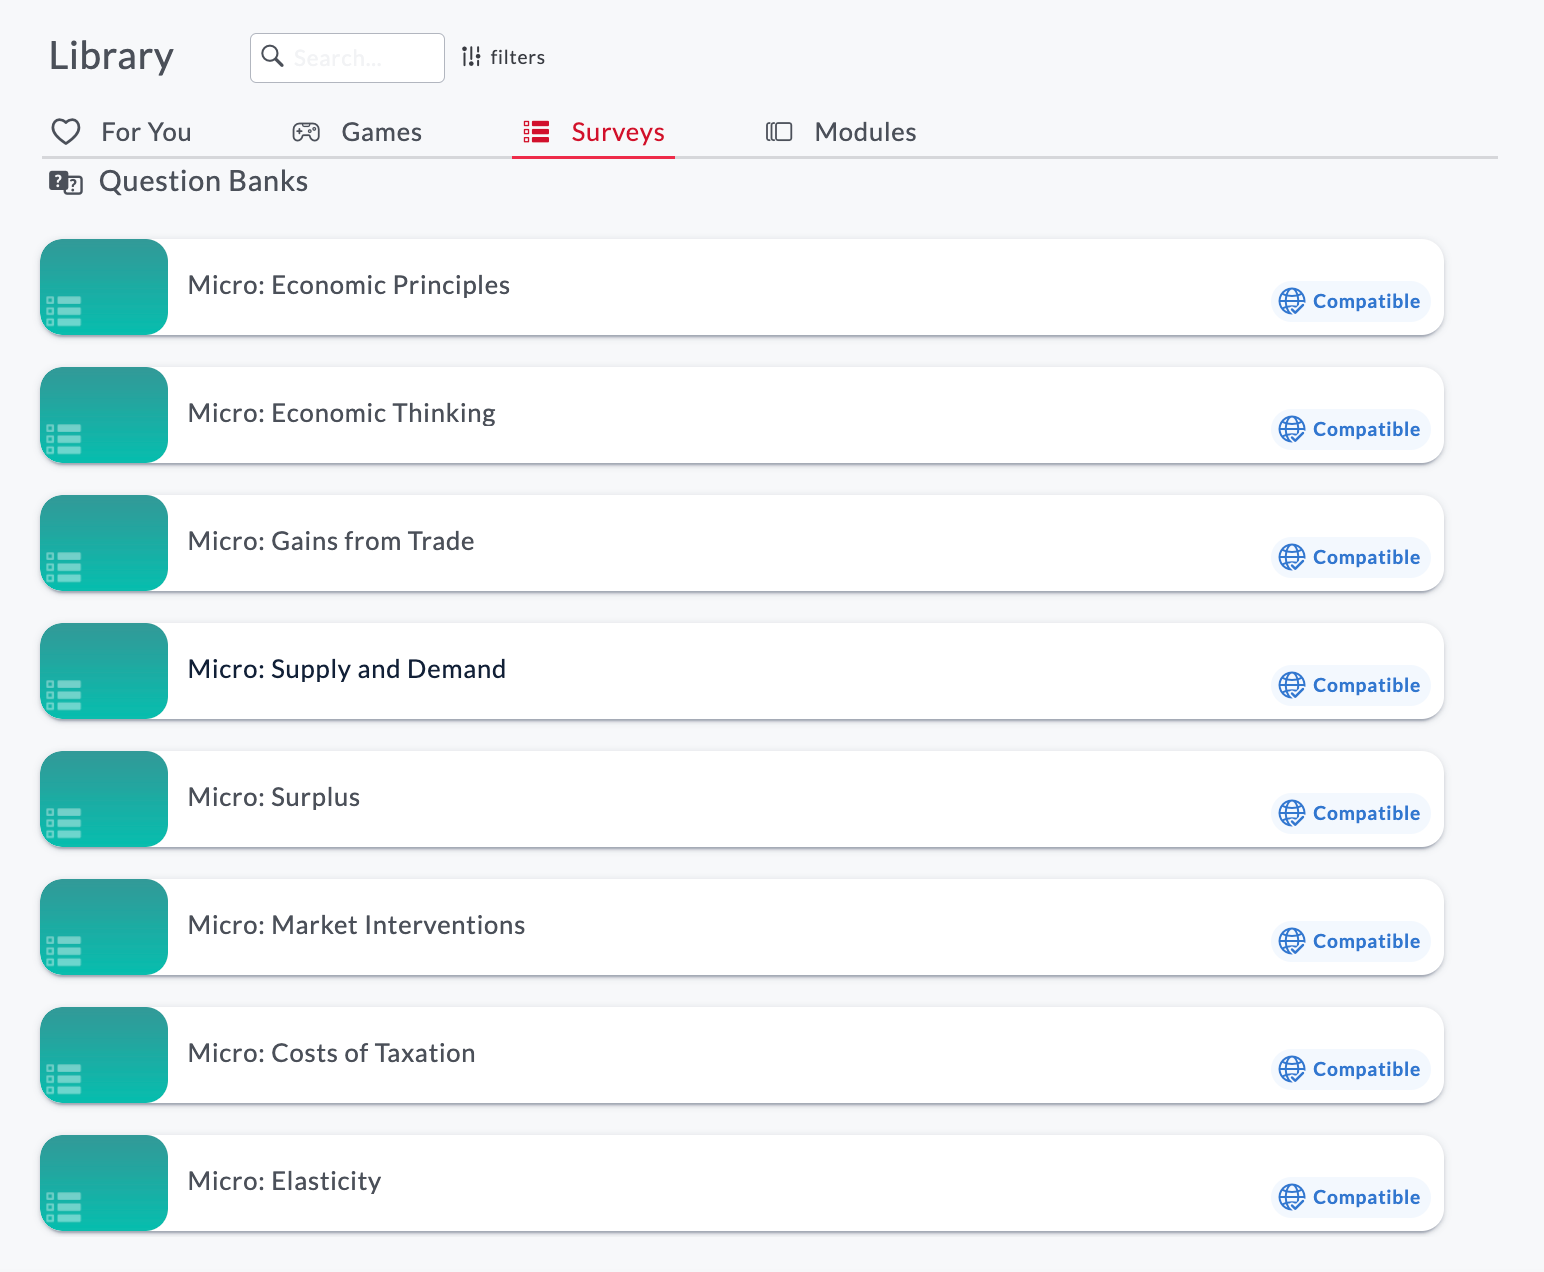
Surveys in MobLab can be used to create quizzes, informational content, and of course, in-class polls. In short, this is where you ask questions and provide content. Here’s an example of what our pre-built microeconomics question bank looks like:
Now Let’s Add Some Media!
Adding an Image
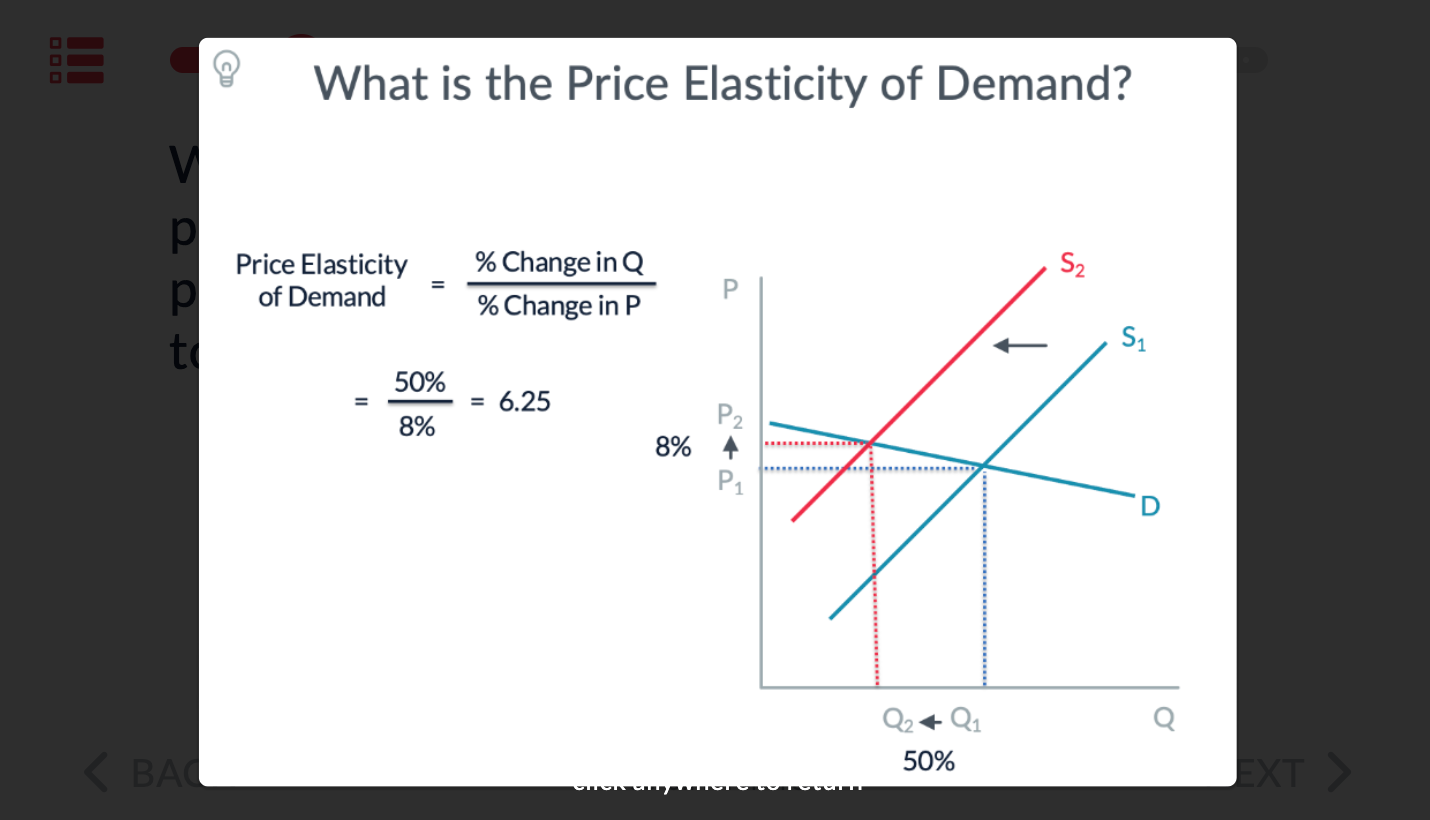
Let’s say we’re teaching an introductory microeconomics class about supply and demand. Specifically, we want to create a multiple choice question for students to answer about elasticity. Rather than having our students engage with just text in our question, we’d like to support the learning with a visual component. A picture of supply and demand curves with corresponding elasticity math will do the trick! By adding this picture, we have created a more memorable experience for students by providing them a visualization of how rates of change and elasticity are related while also reinforcing the text of the question. Using the image of the supply and demand graph in this example also provides a starting point for conversations and feedback between you and your students. As the saying goes, “A picture is worth a thousand words.”
Here’s how we added the image for the elasticity survey question:
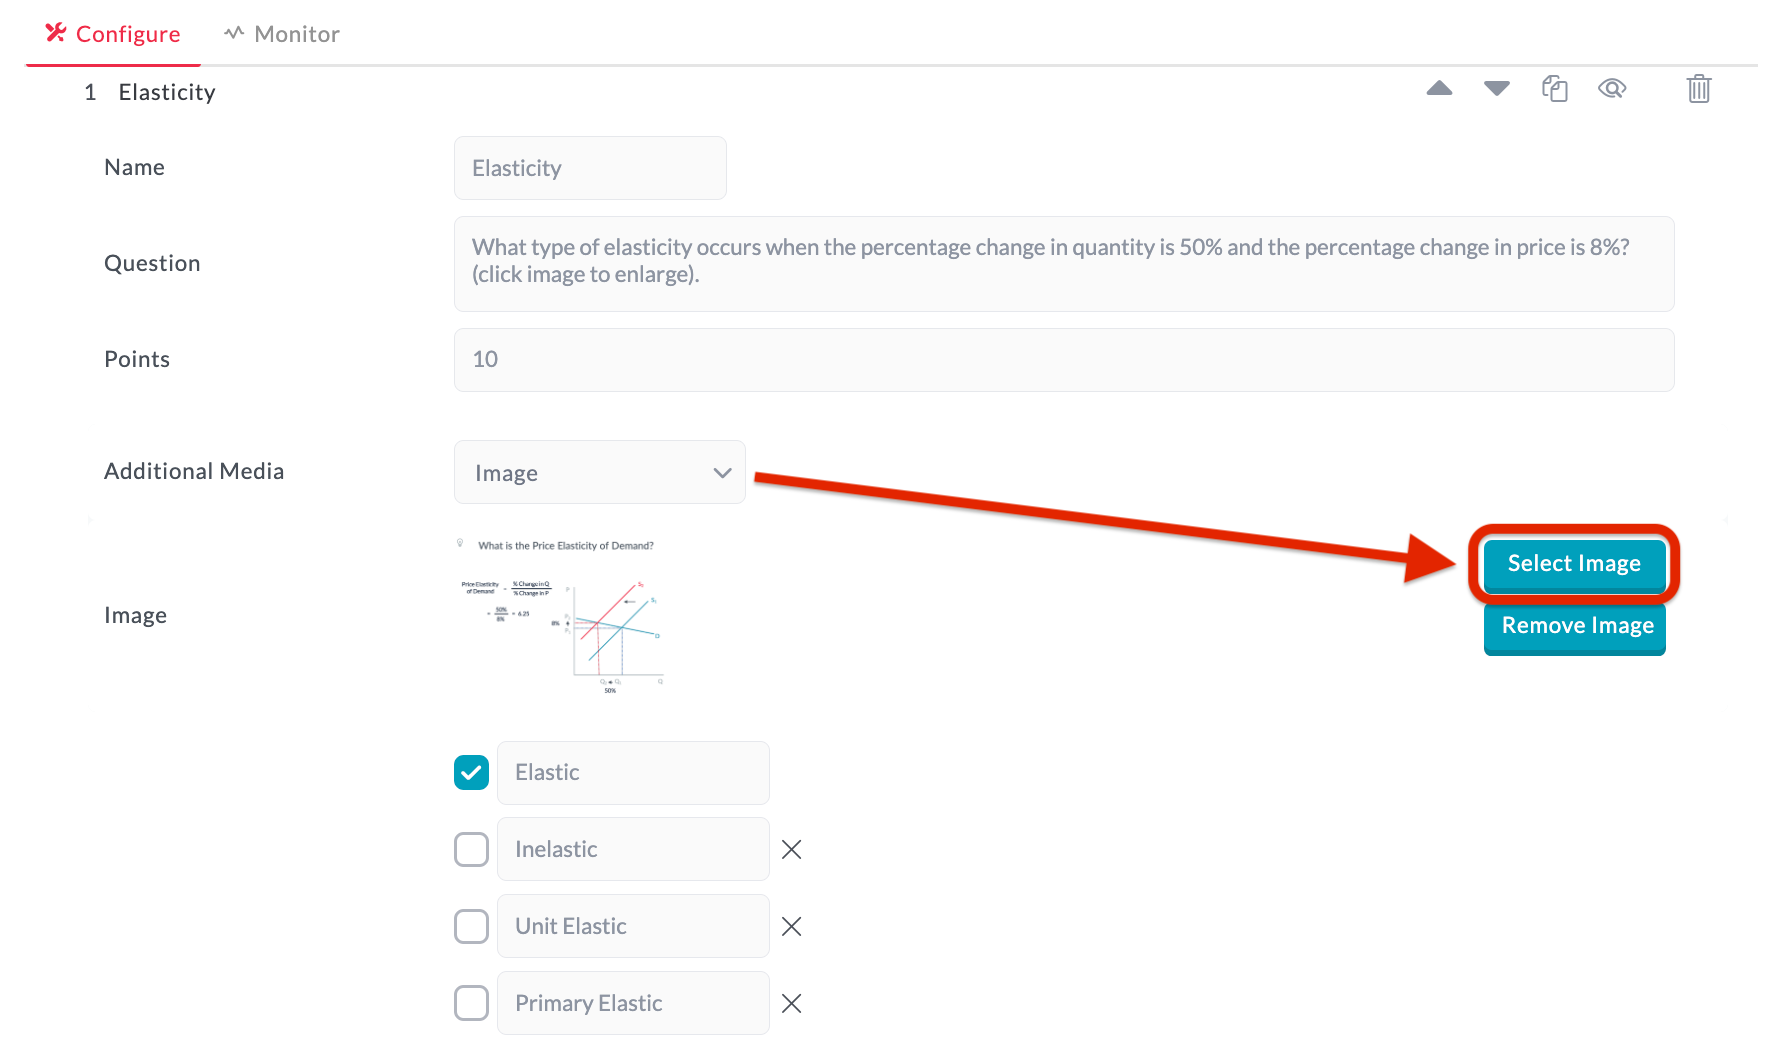
Click Select Image to find and select an image to upload from your computer, or drag and drop an image from your file browser to upload it. In this quiz question example about elasticity, an image of supply and demand curves are used.
With our supply and demand curve image uploaded, this is what our quiz survey looks like from the student’s perspective…
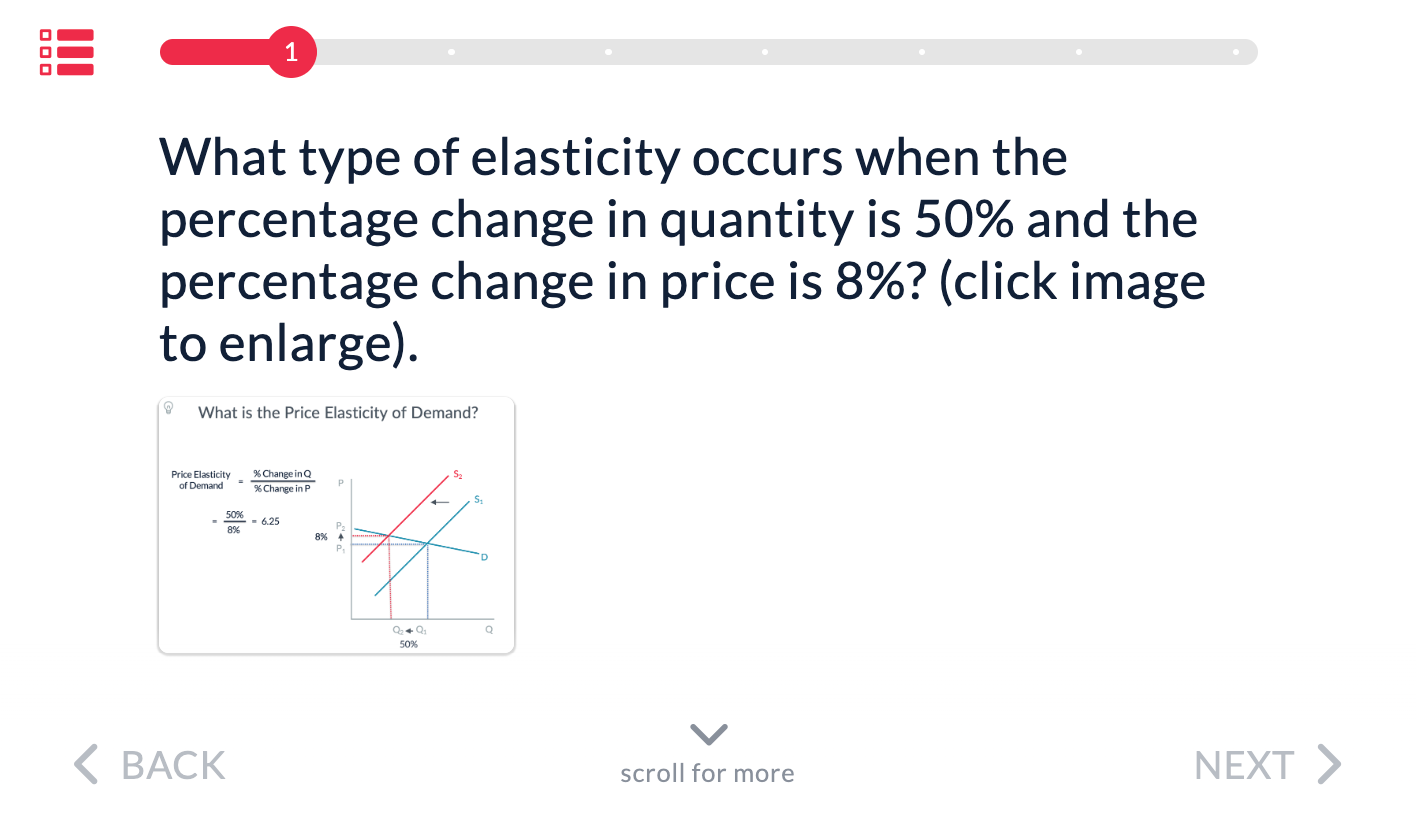
Students can click on the image to enlarge it.
Adding a Video
Let’s say that instead of making a multiple choice quiz using the survey feature, we want to quickly make informational learning content for our students instead. We can do that by adding a video to our informational survey question. This is a very time efficient and powerful way to create fun learning material for your class. In the following example, we’ll be using a microeconomics video from YouTube about the supply curve. Please note that adding videos to surveys is best utilized for out-of-class surveys and online assignments.
To add a video, select Video from the Additional Media field.
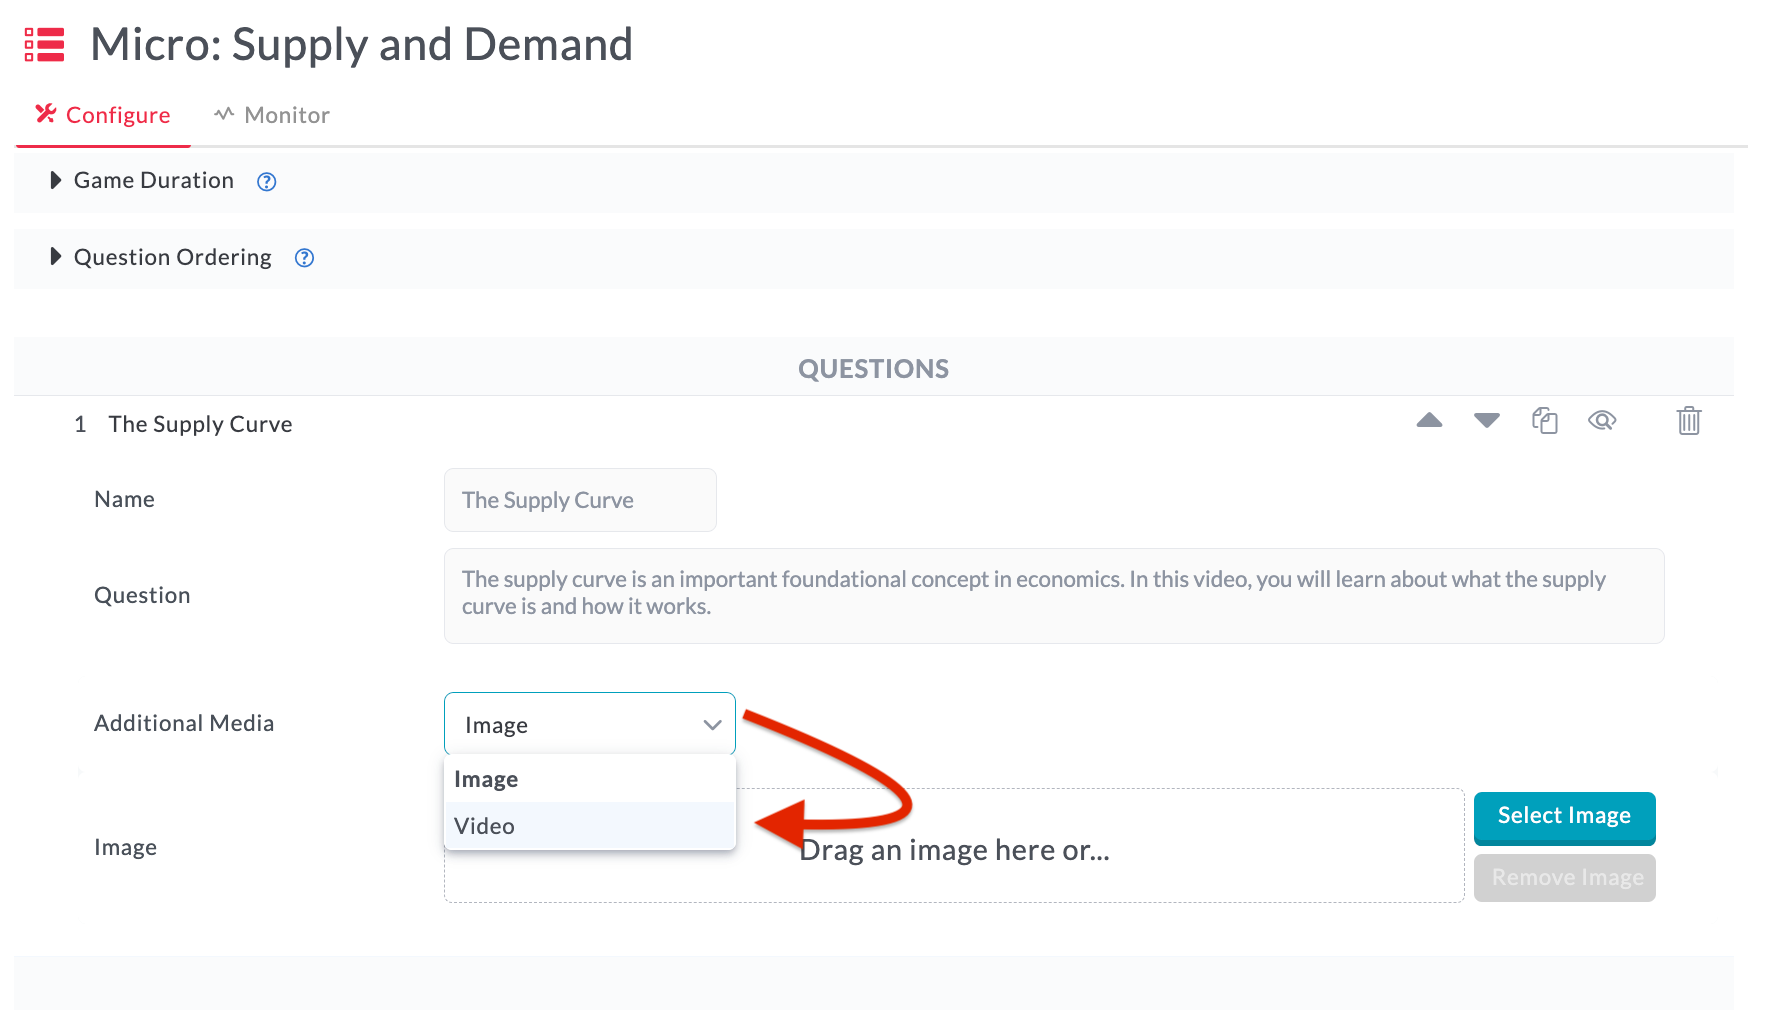
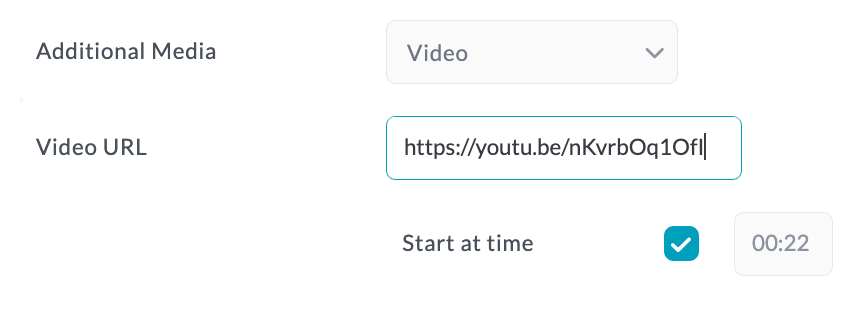
Copy a video URL from YouTube or Vimeo. You can use the Start at time option to automatically start playback at a designated time in the video.
Paste your copied URL into the Video URL field.
This is what the informational learning content looks like, with the supply curve video we uploaded, from the student’s perspective. They just need to click or tap on the play button for the video to start.

And… that’s a wrap! Incorporating media to MobLab surveys is a fun way to create more student interaction and engagement. With just a few clicks, you can be the creative director of your own lesson plans and lectures.
To learn more about MobLab’s surveys, economics games and learning platform, get in touch with our team to schedule a one-on-one demo meeting. Whether you’re teaching in person, online, or both, MobLab has got your class covered with many different exciting games to choose from.


Okay, but why should instructors try using these multimedia features in surveys? Simply put, having a text-only approach can cause some students to lose attention and retention of learning material quickly. By adding media to surveys, instructors can further customize their teaching style ad deliver the learning experience in a memorable way that text simply cannot accomplish in and of itself.
If this is your first time learning about MobLab surveys or need a review, here’s a quick explainer video:
Surveys in MobLab can be used to create quizzes, informational content, and of course, in-class polls. In short, this is where you ask questions and provide content. Here’s an example of what our pre-built microeconomics question bank looks like:

Now Let’s Add Some Media!
Adding an Image
Let’s say we’re teaching an introductory microeconomics class about supply and demand. Specifically, we want to create a multiple choice question for students to answer about elasticity. Rather than having our students engage with just text in our question, we’d like to support the learning with a visual component. A picture of supply and demand curves with corresponding elasticity math will do the trick! By adding this picture, we have created a more memorable experience for students by providing them a visualization of how rates of change and elasticity are related while also reinforcing the text of the question. Using the image of the supply and demand graph in this example also provides a starting point for conversations and feedback between you and your students. As the saying goes, “A picture is worth a thousand words.”
Here’s how we added the image for the elasticity survey question:
Click Select Image to find and select an image to upload from your computer, or drag and drop an image from your file browser to upload it. In this quiz question example about elasticity, an image of supply and demand curves are used.

With our supply and demand curve image uploaded, this is what our quiz survey looks like from the student’s perspective…

Students can click on the image to enlarge it.

Adding a Video
Let’s say that instead of making a multiple choice quiz using the survey feature, we want to quickly make informational learning content for our students instead. We can do that by adding a video to our informational survey question. This is a very time efficient and powerful way to create fun learning material for your class. In the following example, we’ll be using a microeconomics video from YouTube about the supply curve. Please note that adding videos to surveys is best utilized for out-of-class surveys and online assignments.
To add a video, select Video from the Additional Media field.

Copy a video URL from YouTube or Vimeo. You can use the Start at time option to automatically start playback at a designated time in the video.
Paste your copied URL into the Video URL field.

This is what the informational learning content looks like, with the supply curve video we uploaded, from the student’s perspective. They just need to click or tap on the play button for the video to start.

And… that’s a wrap! Incorporating media to MobLab surveys is a fun way to create more student interaction and engagement. With just a few clicks, you can be the creative director of your own lesson plans and lectures.
To learn more about MobLab’s surveys, economics games and learning platform, get in touch with our team to schedule a one-on-one demo meeting. Whether you’re teaching in person, online, or both, MobLab has got your class covered with many different exciting games to choose from.

